PARCA Longitudinal Study Wave 8
A new nationally representative sample of Canadians to investigate a variety of emerging topical areas in response to the evolving needs of Government and partner departments
Impact Canada, Impact & Innovation Unit, Privy Council Office
Key Insights
| Climate Change Perceptions |
|---|
| Belief in climate change has remained high and stable since Wave 1 (Dec 2021), while risk perceptions have varied and appear linked to extreme weather events. Willingness to act, the perceived impact of individual actions, and perceived social norms have fluctuated, but all have declined over time. |
| Mitigation Behaviours |
| Canadians value the repairability of home appliances, power tools, and other electronics, and overwhelmingly support a right-to-repair law. Among four home energy saving measures, respondents are more willing to engage in those they see as more effective; however, their perceptions of effectiveness notably differ from expert judgments. |
| Adaptation Behaviours |
| Two thirds of Canadians say they have experienced more extreme weather than usual in the past two years, with higher levels among respondents living in BC and the Atlantic provinces. Only one fifth of Canadians think their communities are prepared for climate change, but twice as many think their households are prepared. Three quarters have a cooling system in their home, the most common adaptation-related feature. Over 40% have experienced first- or second-hand wildfire impacts in the past two years, but most have taken no wildfire-related actions and are not familiar with the FireSmart program. |
| Climate Science Literacy |
| On a 5-question climate science quiz, most people scored 60% or lower. Respondents most often misclassified water vapour as a non-greenhouse gas, and incorrectly identified developing countries (i.e., China, India, Brazil) as having the highest per capita emissions in the world. |
| Climate Policy Support |
|
Support for carbon pricing hovers around 60% but has fluctuated in response to current events. Most Canadians think of carbon pricing as costing their households more than they receive in payments, but people express more support for a carbon pricing system that uses revenues to fund environmental projects instead of making payments to households (i.e., the current approach). Respondents perceive greater environmental, social, and economic benefits from carbon pricing when endorsed by ‘climate scientists’, compared to endorsement by ‘economists’ or no clear endorsement.
Nearly all Canadians support planting two billion trees. Most people have heard of offset credits but do not believe they are effective and are ambivalent about their use by industry. |
| Nature and Wellbeing |
| Most Canadians are spending time in parks or natural spaces at least once a week, though the frequency has decreased in the winter. Most people have a decent park within a five-minute walk of their home, and the vast majority say they feel highly connected to nature and enjoy spending time in nature. Overall, most people feel at least somewhat satisfied with their life and find the things they do worthwhile, but only half report very good health. |
| Trust in Government |
| Only a third of Canadians trust the federal government to make good decisions on climate change. Even among those who believe in climate change and/or are worried about it, fewer than half trust the government on the issue. |
Background
In September 2021, in partnership with Environment and Climate Change Canada (ECCC) and Natural Resources Canada (NRCan), the Impact and Innovation Unit launched a multi-year program of research on climate change. The Program of Applied Research on Climate Action in Canada (PARCA) will combine behavioural science insights and methods with robust policy analysis to promote climate action.
Together with ECCC and NRCan, we will learn about how Canadians think, feel and act in response to climate change and the risks it creates. We will then develop and test, online and in the real world, specific behaviourally-informed solutions with the potential to reduce GHG emissions and promote climate adaptation at the individual and community level. This work will generate new insights on a rapid timeframe and use them to inform policy development, program design, and public communications.
Methodology
The study is conducted with a General Population Random Sample using a longitudinal design (i.e. the same participants, where possible, will be completing the survey each wave), along with oversampling of underrepresented populations and other specific populations of interest. This initial study will span eight waves between December 2021 and March 2023, with data collected every two months to allow for optimal monitoring.
-
Advisory Committee
The longitudinal survey is designed in consultation with an advisory committee of academics and practitioners. The committee consists of subject matter experts from a diverse range of backgrounds, including behavioural science, environmental psychology, communications, political science, anthropology, climate policy, and sustainability.
-
Survey Objectives
The PARCA longitudinal study is public opinion research that uses a large and nationally representative sample of Canadians to gather data and track changes over time about how Canadians think, feel, and act in response to climate change and its impacts. The robust, quantitative evidence generated by this study will help identify where there is potential for promoting greater individual climate and environmental action.
-
Data Collection & Analysis
Surveys are conducted online, in English and French, by Advanis, a leading Canadian market research company. Respondents are recruited through random digit dialing calls and invited to complete the survey online. Each wave takes about 20 minutes to complete, after which participants are asked whether they may be contacted for future waves.
To ensure the sample is broadly representative of the Canadian population and to allow for analyses within and between subgroups of interests (e.g. regions, provinces, age groups, vulnerable groups), each wave consists of 2,000 participants. The sample includes general population respondents (n=1,500) weighted by region, age group, gender, and education using data from the 2016 Census, as well as an oversample (n=500) of populations of specific interest, which may change from one wave to the next. In Wave 1, the oversample was used to extend the general population sample to 2,000 participants.
Impact Canada conducts exploratory and confirmatory data analyses using descriptive and inferential statistics to identify emerging trends and test relationships among variables.
Considerations
Data Collected:
February 23 – March 12, 2023
Sample Size:
2,079 Canadians aged 18 years and older.
When interpreting the PARCA results, it is useful to keep in mind the context of the data collection period, which may have influenced the responses of survey participants. Prior to and during the Wave 8 data collection period:
- Notable weather events in Canada included a severe snowstorm in Ontario and Quebec shortly before Christmas, which resulted in power outages, and stranded rail and air passengers.
- The Russian invasion of Ukraine and sanctions against Russian oil and gas continued. Ongoing energy security and geopolitical concerns continued to drive calls for fossil fuel production and an accelerated renewable energy transition.
- On February 17, the Government of Canada announced the interim Sustainable Jobs Plan, with the aim of creating sustainable jobs to help workers transition away from the fossil fuel sector and towards clean energy. The plan includes the establishment of a new training centre for sustainable jobs, and a new government advisory body.
- A Canadian Security Intelligence Service (CSIS) report on ongoing climate change-related threats to national security and prosperity was released on March 5. Noted risks included the loss of parts of BC and the Atlantic provinces to flooding, loss of food and freshwater resources, increasing levels of human migration to Canada, and an increasing ideological divide on the issue of climate change.
- In the weeks and months leading up to the release of Budget 2023 on March 28, there were calls from various groups for Canada to match US levels of green investment. President Biden pledged $370 billion in tax credits to the renewable energy industry in the Inflation Reduction Act in August 2022, and there were concerns that Canada would risk missing out on important economic opportunities should the Government not increase funding levels to attract foreign and domestic investments.
Climate Change Attitudes & Perceptions
While belief in climate change has been stable, risk perceptions have varied over time
Most respondents (70%) in Wave 8 (Feb 2023) strongly agree that climate change is real, but only half strongly agree that it is primarily caused by human activity (53%), and that it will have serious negative consequences (56%). Belief in climate change and its human causes has been relatively stable over time, and the apparent drop in belief in Wave 8 is not statistically significant. In contrast, risk perceptions have varied over time, and are linked in part to respondents’ recent experience of extreme weather.Emotional responses to climate change relatively stable, decrease in reported confusion over time
Half of respondents (49%) remain very or extremely worried about climate change, while a third (33%) feel very or extremely anxious. People who feel very or extremely hopeful are a small minority (14%), and 10% continue to feel very or extremely confused, down from 14% in Wave 1.Overall decline in willingness to act, self-efficacy, and perceived social norms over time
About two thirds of respondents are willing to act to limit climate change (68%), and agree that their actions are impactful (i.e., self-efficacy) (63%). The decrease in willingness to act since Wave 7 is statistically significant. In terms of social norms, only about half of respondents think that people close to them expect them to act (55%), or that their family and friends are taking action (50%). Compared to the stability over time in climate change belief, these measures have varied throughout the year. Willingness to act, self-efficacy, and perceived social norms have all declined over time, a gradual but statistically significant trend.Climate Change Mitigation Behaviours
Most Canadians repaired items at least once in past two months, but examples shaped answers
While frequent repairing of products (i.e., once a week or more) is rare, most respondents (71%) in Wave 8 report having repaired items at least once in the last two months. The examples given for items that could be repaired were changed from clothing, household items and electronics (in Waves 1 and 7) to home appliances, electronics and power tools (Wave 8) to align with later questions about repairability and right-to-repair laws. This change seems to have affected people’s responses. Whereas there was no difference in reported frequencies between Waves 1 and 7, respondents in Wave 8 report repairing items less frequently when prompted with the new examples.Canadians most value the repairability of major home appliances, less so for small appliances
Respondents were asked to rate how important repairability is compared to other factors across various product categories. Nearly all (88%) indicate that the repairability of major home appliances is very or somewhat important, significantly higher than for other categories. Many also indicate that repairability is important for home electronics (80%) and electric power tools (77%), but with a lower proportion selecting very important. Though lowest for small home appliances, two thirds (68%) still rated repairability as important for this category. The emphasis placed on repairability seems likely to vary with the typical cost of the product, with repairability more important for costlier products.Respondents least willing to save energy by air-drying laundry instead of using a dryer
Of the home energy saving actions investigated in Wave 8, the most common is turning off the lights when they are not in use. Nearly half of respondents (43%) report doing this most of the time, while the fewest (18%) report air drying their laundry most of the time. Similarly, among those not already acting, respondents are most willing to turn off lights (48%) and least willing to air dry laundry (27%). Although more people report already setting their thermostats lower than usual in the winter (30%) compared to those who use a water efficient shower head (25%), among those not already taking these actions, respondents were significantly more willing to use a water efficient shower head (46%) than to adjust their thermostat (32%).Small differences in perceived efficacy of energy saving actions, few see any action as ineffective
The same share of respondents perceive turning off the lights and air-drying to be effective at saving energy (57%). Somewhat fewer think the same of turning down the thermostat in winter (52%) or using a water efficient shower head (45%). Very few respondents (9-12%) think that any of these actions are ineffective at saving energy. These ratings are notably inconsistent with expert judgments* that lowering the thermostat (10 on a 10-point scale) and using a water efficient shower head (8) are much more effective than air-drying laundry (4) and turning off the lights (1). * Source: www.bi.team/blogs/new-survey-shows-a-uk-energy-saving-campaign-is-much-needed/Canadians are more willing to engage in behaviours they think are more effective at saving energy
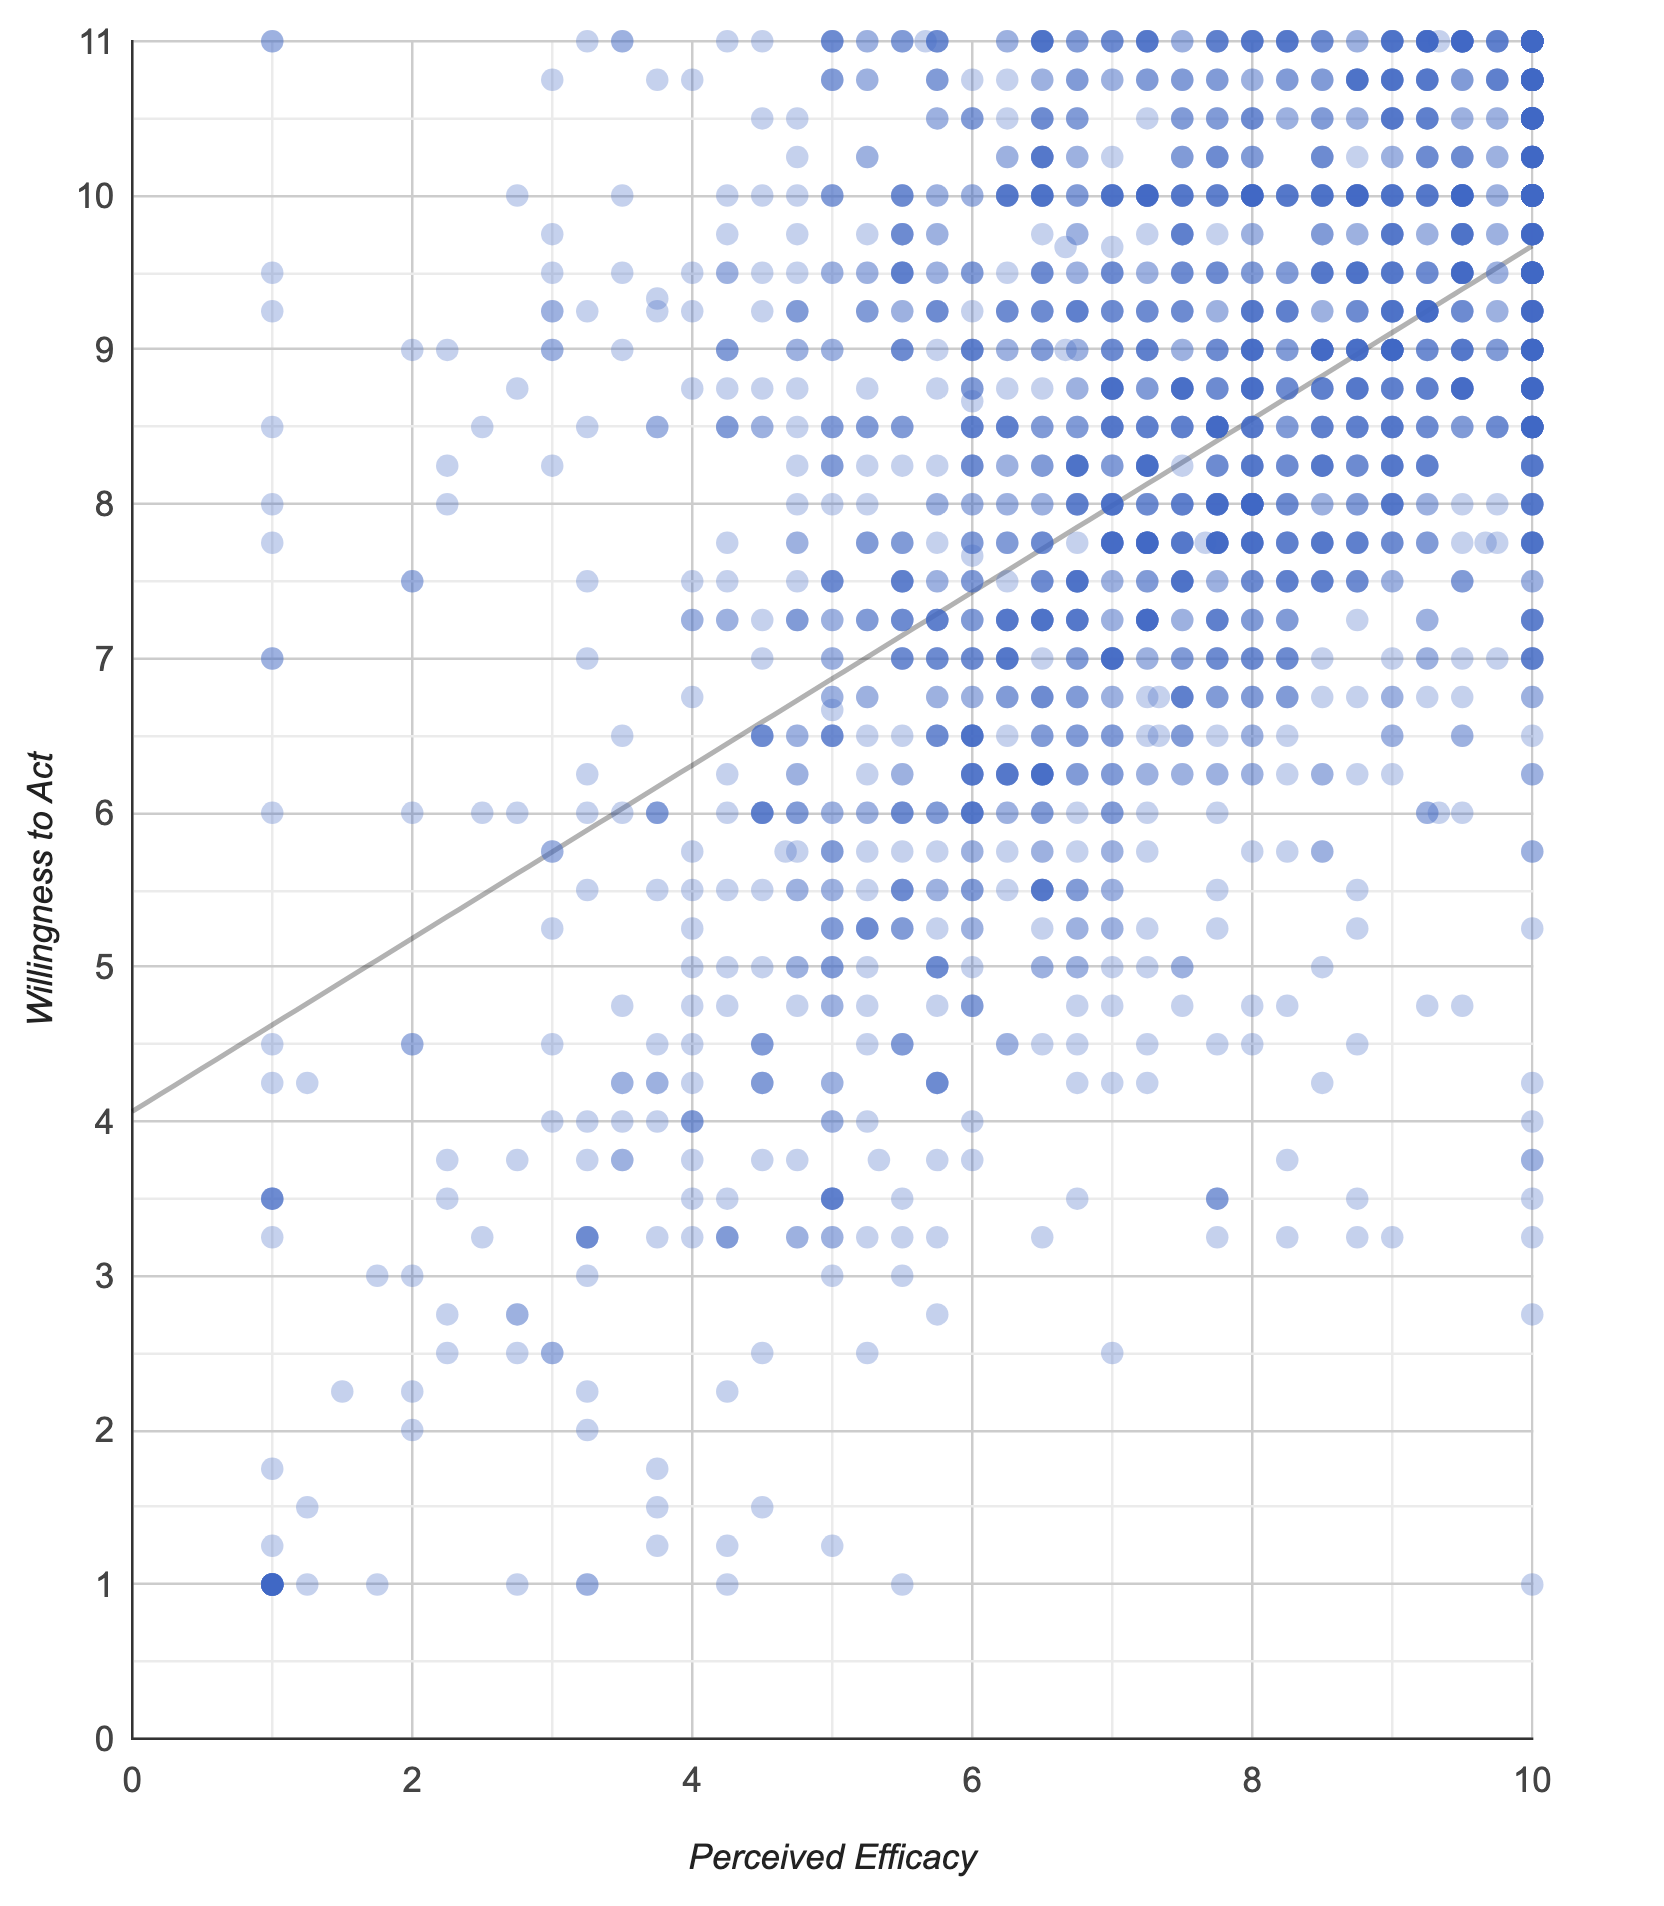
The more effective that respondents perceive an action to be, the more willing they are to engage in it, and vice versa. The scatterplot shows respondents’ willingness to engage, averaged across the four energy-saving behaviours, compared to their perceptions of the average effectiveness (or efficacy) of those same behaviours. The relationship (correlation) between the two composite measures is statistically significant, with a medium-to-large effect size. Similar statistically significant correlations were observed for each behaviour when considered separately. Note: Willingness to act includes respondents who already perform those actions most of the time (i.e., coded as 11, as an extension of the 10-point scale).
Figure 9. Respondents’ willingness to engage, averaged across the four energy-saving behaviours, compared to their perceptions of the average effectiveness (or efficacy) of those same behaviours.
-
Figure - Text description
Respondents’ willingness to engage, averaged across the four energy-saving behaviours, compared to their perceptions of the average effectiveness (or efficacy) of those same behaviours.
The scatterplot shows respondents’ willingness to engage, averaged across the four energy-saving behaviours, compared to their perceptions of the average effectiveness (or efficacy) of those same behaviours. The relationship (correlation) between the two composite measures is statistically significant, with a medium-to-large effect size (willingness to act = 0.561 * perceived efficacy + 4.065).
Climate Change Adaptation Behaviours
Residents of BC and Atlantic Canada report more extreme weather experiences in recent years
Two thirds of respondents (66%) said they have personally experienced more extreme weather in their local area over the last two years compared to usual. BC and Atlantic residents more often report unusually frequent extreme weather than residents of other regions, a statistically significant difference.Canadians think their households are more prepared for climate change than their communities
When asked about preparing for the impacts of climate change, twice as many respondents said their household is prepared (42% strongly or somewhat agree) compared to their community (21%), a statistically significant difference. Those who are older (55+), live in the Atlantic provinces, or live in rural areas are more likely than others to indicate that their household is prepared for the impacts of climate change. Parents are more likely than non-parents to indicate preparedness in both their household and community, but no other demographic factors have a significant impact on perception of community preparedness.Most Canadians have a cooling system in their home, highest intention to get emergency supply kit
Most respondents (72%) report having a cooling system in their home, with only 4% planning to add one in the next year. About half have trees that were planted for shade (49%), and possess an emergency supply kit for their home (44%). Among those who do not have a given item, respondents most often intend to get an emergency supply kit (17%) and a rainwater harvesting system (11%) in the next year. Only 12% have never considered an emergency supply kit. Very few people have de-paved their driveway (14%), and the vast majority (76%) are not planning to do so.Two fifths of Canadians have experienced first- or second-hand impacts of wildfires in past 5 years
Two fifths of respondents (41%) have experienced, or know someone who has experienced, negative impacts caused by wildfires or wildfire smoke in the past five years. Among those who report such experiences, negative impacts on mental health are most common (23%), followed by evacuation (20%), and negative impacts on employment (18%). Most of these experiences are second-hand, meaning respondents know someone who has had these experiences rather than having experienced them directly themselves. For instance, nine times as many people know someone who had to evacuate than did so themselves, while only twice as many know someone who experienced mental health impacts as have experienced such impacts themselves.Low familiarity with FireSmart, most common wildfire-related action is information seeking
Most respondents have not taken any actions related to wildfires in the past five years, and of those who have, the most common was seeking information about wildfire risk in their local area (18%). Regarding FireSmart, a national program that helps Canadians increase community resilience to wildfires and minimize negative impacts, most respondents (84%) are not at all familiar with it. Though awareness is low across all community sizes, rural residents are somewhat more likely to say they are familiar or very familiar with the program (7%) than are residents of urban areas (2-4%).Climate Science Literacy
Most score 60% or lower on climate science literacy overall, but better on some questions
Overall, most respondents (55%) answered 2 to 3 questions correctly out of five. About a quarter (27%) had 0 to 1 correct answers, while a fifth (18%) answered 4 to 5 questions correctly. Performance varied widely by question. Most respondents (87%) correctly identified methane as a greenhouse gas (GHG), but many (72%) failed to single out nitrogen as a non-GHG. Of note, 62% incorrectly thought that water vapour was the non-GHG. This suggests that certain elements of climate science literacy are more widely known than others (or are easier to guess in a multiple-choice format).Significant misperceptions about water vapour and per capita emissions in large, developing countries
More than half of respondents selected wrong answers for two of the climate literacy questions. When asked which gas is not a GHG, nearly two thirds of respondents (62%) chose water vapour – more than four times higher than the share who chose nitrogen, the correct answer. When asked which group of countries has the largest per capita emissions of GHGs, more than half of respondents (56%) selected China, India and Brazil, nearly twice as many as chose Australia, the United States and Canada, the correct answer.Respondents who don’t believe in climate change perform more poorly on climate literacy questions
Over half of respondents (59%) who disagree that climate change is real got 0-1 climate science literacy questions right, compared to respondents who agree that it is real (22%) or who neither agree nor disagree (40%). More respondents who agree that climate change is real got 4-5 answers right (20%) compared to those who disagree (5%) or neither (10%). Similarly, respondents tended to answer more questions correctly if they were worried about climate change, willing to make substantial lifestyle changes to limit it, or perceived themselves to have experienced more local extreme weather than usual in the last two years.Support for Climate Policies
High support for right to repair and tree planting, mixed support for carbon pricing
Creating a right-to-repair law and planting two billion trees are both highly supported by respondents (90-91% somewhat or strongly support). Funding wildfire prevention has 82% support, while support for national carbon pricing remains around 59%. As Canada’s proposed right-to-repair law would require that manufacturers provide both spare parts and manual to consumers, the survey used a split sample experiment to see if there is any differences in support for these two elements. There is no difference in support between a right-to-repair law that focusses on spare parts and one that focusses on manuals.Support for national carbon pricing hovers around 60%, seems influenced by current events
Longitudinal data suggest that support for carbon pricing fluctuates somewhat over time, with levels of support ranging from aa high of 63% (Dec 2021) to a low of 56% (Apr 2022) but hovering around 60%. Although relatively small, these wave-to-wave changes are statistically significant and suggest that support for carbon pricing may be influenced by current events. For example, support was lowest in Wave 3, following the Russian invasion of Ukraine, which caused oil prices to rise rapidly and generated calls for more fossil fuel development.More Canadians see net household loss from carbon pricing than see benefits for climate and society
Half of respondents (52%) strongly or somewhat agree that carbon pricing costs their household more than they receive in payments. In comparison, fewer respondents agree that carbon pricing reduces air pollution (43%) and GHG emissions (41%), distributes the costs of climate action fairly (32%), or helps the Canadian economy to grow (27%).Canadians see more climate/societal benefits when carbon pricing is endorsed by climate scientists
We conducted a framing experiment on perceptions of carbon pricing to understand how endorsement by economists and climate scientists shaped respondents’ answers. Prior to the carbon pricing questions, each respondent was randomly assigned to one of four groups (three different introductions, plus no introduction [control group]; these framings are provided at the end of this report). The ‘neutral’ introduction claimed that carbon pricing has been identified as an efficient and effective way to limit climate change in Canada, while the other two attributed this claim to either ‘economists’ or ‘climate scientists’. Among the four framings, endorsement by climate scientists significantly increased levels of agreement on statements related to air pollution, GHG emissions, fairness in the distribution of costs, and positive impact on the economy. However, it had no effect on people’s opinions of their own net costs or on the cost-effectiveness of overall GHG reductions. Notably, endorsement by economists did not increase the perception that carbon pricing helps the Canadian economy to grow. And there were no significant differences between the Neutral endorsement and the control group.Higher support if revenues used for environmental projects instead of household payments
Support for carbon pricing varies significantly depending on how revenues are used. More respondents support carbon pricing if the revenues are used to fund environmental projects (71% strongly or somewhat support), rather than providing payments to households, whether equally (45%) or favouring low-income households (53%). Providing equal refunds to all households attracted the lowest overall support (45%), as well as the lowest strong support (17%). In contrast, carbon pricing received 59% overall support and 36% strong support when asked without any qualifiers earlier in the survey.Majority of Canadians have heard of offset credits, mixed support for allowing industry to use them
When respondents were asked, without context, if they had ever heard of ‘offset credits’, more than half (59%) indicated familiarity. They then read a brief explanation, including their potential uses by industry and individuals, before being randomly assigned to two questions about their potential use by industry towards voluntary goals and mandatory requirements. While support is relatively low across both framings, more respondents indicated support for allowing industry to use offset credits to comply with voluntary goals (37%) than for mandatory regulations (33%).Canadians do not see carbon offsets as effective for reducing GHG emissions
While two thirds of respondents (64%) agree that it is important to reduce their GHG emissions when travelling or attending events, only a quarter (26%) would buy offset credits to do so. This may be because only a quarter (27%) of respondents strongly or somewhat agree that carbon offsets are an effective way to reduce GHG emissions. A split sample was used to test whether Canadians believe that allowing people to use carbon offset credits translates into buying more vs. travelling more. Respondents are more likely to agree that using carbon offset credits for products leads people to buy more (21%) than to travel more (18%), but overall, most people do not believe that using offset credits will increase consumption.Nature and Wellbeing
Time spent in parks and natural spaces varies by season
The frequency of time spent in parks or other natural spaces appears to vary by season. In Wave 5 (Aug 2022), three quarters of respondents (77%) reported spending time in parks at least once a week, while that number dropped to two thirds (66%) in Wave 8 (Feb 2023).Most Canadians have access to parks within a five-minute walk from their home
Most respondents (86%) have a park or other natural space, where they would generally want to spend time, within a five-minute walk from their home. Of the small minority (13%) who do not have such a park nearby, about half indicate that they live in an area without parks nearby (48%), with a further 10% citing their remote/rural area (10%).Canadians feel highly connected to nature, find spending time in nature enjoyable and important
Most respondents report a high degree of connection to nature, indicating that they find beauty in nature (96% strongly or somewhat agree), are made happy by nature (94%), and feel it is important to spend time in nature (91%). A smaller majority also agree that they are the type of person who acts in an environmentally-friendly way (59%), though only a quarter (27%) strongly agree. A small minority of respondents (12%) said that they sometimes feel uncomfortable, anxious, or fearful in nature.Most Canadians are somewhat satisfied with life and find the things they do worthwhile, but only half are in very good health
Overall, most respondents say that they are somewhat or completely satisfied with their life as a whole (79%), and feel that the things they do in life are worthwhile (61%). Older Canadians (aged 55+), those who are university educated, and those who are parents are more likely to be satisfied with life and to find things they do worthwhile. However, just half of respondents (49%) consider their physical health to be excellent or very good. People with access to parks and/or a greater connection to nature report higher wellbeing on the measures shown here.Trust in Government
Only 1 in 3 Canadians trust federal government to make good decisions on climate change, with differences by climate beliefs and attitudes
More respondents distrust (52%) than trust (35%) the Government of Canada to make good decisions about climate change, with another 13% who are in between. Trust on this issue is strongly related to other climate change attitudes; of those who agree that climate change is real, only 40% trust the Government of Canada on the issue. Those who neither agree nor disagree that climate change is real, and those who disagree, express virtually no trust in the government. The share of respondents who trust the Government of Canada on climate change is identical between those who are slightly/moderately worried and those who are very/extremely worried (43% and 45%).Older Canadians, immigrants, and those living in Atlantic provinces have higher trust in government on climate change
Certain demographic factors are also related to respondents’ trust in the Government of Canada on climate change. Those aged 55+ are significantly more likely to trust the government compared to younger age groups. Immigrants report higher trust than non-immigrants, and long-term immigrants trust the government less than recent immigrants. Regionally, residents of the Atlantic provinces trust the government at significantly higher rates than residents of Quebec, MB/SK/NU, and AB/NT. The Prairie provinces have significantly higher distrust than other regions. However, it’s worth noting that distrust of government is higher than trust in all regions of Canada.Regional Profiles
| Regional Profile | Canada | BC/YK | AB/NT | MB/SK/ NU | ON | QC | ATL |
|---|---|---|---|---|---|---|---|
| (n=2,079) | (n=332) | (n=285) | (n=203) | (n=677) | (n=326) | (n=256) | |
| Age | |||||||
| 18-34 years | 27% | 26% | 29% | 29% | 28% | 25% | 23% |
| 35-54 years | 32% | 32% | 36% | 32% | 32% | 32% | 30% |
| 55 years and older | 41% | 42% | 35% | 39% | 40% | 44% | 47% |
| Gender | |||||||
| Male | 48% | 48% | 49% | 46% | 47% | 49% | 48% |
| Female | 50% | 49% | 49% | 52% | 50% | 50% | 50% |
| Other | 2% | 3% | 2% | 2% | 3% | 1% | 2% |
| Education | |||||||
| High school or less | 9% | 11% | 11% | 10% | 8% | 7% | 11% |
| College/trades | 41% | 41% | 48% | 41% | 39% | 41% | 39% |
| University / post-graduate | 49% | 48% | 39% | 48% | 52% | 51% | 49% |
| Size of community | |||||||
| A large city | 44% | 38% | 57% | 43% | 49% | 40% | 14% |
| A suburb near a large city | 19% | 24% | 9% | 4% | 16% | 33% | 11% |
| A small city or town | 25% | 27% | 20% | 30% | 24% | 21% | 47% |
| A rural area | 11% | 11% | 13% | 23% | 9% | 6% | 28% |
| Employment | |||||||
| Full-time (30+ hours per week) | 47% | 48% | 51% | 44% | 44% | 51% | 47% |
| Part-time ([30 hours per week) | 7% | 5% | 9% | 10% | 8% | 6% | 6% |
| Self-employed | 11% | 12% | 16% | 12% | 11% | 7% | 9% |
| Unemployed | 3% | 4% | 3% | 4% | 2% | 2% | 4% |
| Full-time student | 5% | 4% | 3% | 3% | 7% | 5% | 3% |
| Retired | 22% | 23% | 14% | 22% | 22% | 24% | 28% |
| Full-time homemaker | 2% | 2% | 2% | 2% | 2% | 1% | 1% |
| Other | 2% | 2% | 1% | 3% | 3% | 2% | 2% |
| Income | |||||||
| Under $20,000 | 4% | 4% | 4% | 4% | 4% | 3% | 4% |
| $20,000 to just under $40,000 | 8% | 8% | 7% | 10% | 6% | 9% | 13% |
| $40,000 to just under $60,000 | 10% | 10% | 8% | 9% | 10% | 10% | 11% |
| $60,000 to just under $80,000 | 13% | 11% | 11% | 15% | 12% | 12% | 17% |
| $80,000 to just under $100,000 | 14% | 15% | 13% | 13% | 13% | 16% | 15% |
| $100,000 to just under $150,000 | 19% | 18% | 20% | 25% | 18% | 20% | 17% |
| $150,000 to just under $200,000 | 12% | 11% | 14% | 7% | 12% | 12% | 8% |
| $200,000 to just under $250,000 | 4% | 5% | 4% | 5% | 4% | 3% | 5% |
| $250,000 and above | 7% | 7% | 4% | 6% | 9% | 5% | 3% |
| Household size | |||||||
| 1-2 | 58% | 60% | 55% | 49% | 60% | 59% | 61% |
| 3-4 | 32% | 32% | 31% | 37% | 30% | 36% | 32% |
| 5+ | 9% | 7% | 14% | 15% | 11% | 5% | 7% |
| Parents | |||||||
| Yes | 61% | 56% | 67% | 70% | 55% | 66% | 68% |
| Children under 18 | |||||||
| Yes | 24% | 20% | 34% | 34% | 18% | 30% | 22% |
| Language(s) spoken at home | |||||||
| English | 74% | 96% | 94% | 96% | 91% | 10% | 95% |
| French | 21% | 1% | 1% | 1% | 2% | 87% | 3% |
| Spanish | 1% | 1% | 0% | 0% | 1% | 1% | 0% |
| Other | 4% | 2% | 5% | 3% | 6% | 2% | 2% |
| Home ownership | |||||||
| Owned | 72% | 65% | 80% | 81% | 70% | 71% | 79% |
| Rented | 26% | 34% | 18% | 18% | 28% | 26% | 20% |
| Immigration | |||||||
| Born in Canada | 83% | 76% | 85% | 90% | 78% | 92% | 89% |
| Recent immigrants (2001-2021) | 6% | 8% | 5% | 3% | 7% | 3% | 6% |
| Long-term immigrants (2000 and before) | 9% | 14% | 8% | 6% | 13% | 4% | 4% |
| Prefer not to say | 2% | 2% | 2% | 1% | 3% | 1% | 1% |
| Ethnicity | |||||||
| White | 84% | 80% | 81% | 79% | 80% | 93% | 90% |
| South Asian (e.g., East Indian, Pakistani, Sri Lankan, etc.) | 2% | 2% | 1% | 1% | 3% | 0% | 1% |
| Chinese | 2% | 3% | 1% | 1% | 3% | 1% | 1% |
| Black | 2% | 1% | 1% | 1% | 3% | 2% | 1% |
| Filipino | 1% | 1% | 1% | 0% | 1% | 0% | 1% |
| Latin American | 2% | 2% | 2% | 2% | 2% | 1% | 0% |
| Arab | 1% | 0% | 1% | 1% | 1% | 0% | 0% |
| Southeast Asian | 1% | 1% | 0% | 0% | 1% | 0% | 1% |
| West Asian | 1% | 2% | 0% | 0% | 1% | 0% | 0% |
| Korean | 0% | 0% | 0% | 0% | 0% | 0% | 0% |
| Japanese | 0% | 2% | 0% | 0% | 0% | 0% | 0% |
| Other | 4% | 6% | 4% | 6% | 4% | 2% | 3% |
| Prefer not to say | 5% | 6% | 11% | 12% | 5% | 1% | 4% |