COSMO Wave 1.7
Increased focus on Canadians' knowledge and attitudes related to vaccines, intentions to get an influenza shot in the fall/winter, and a look at the use of alcohol and other substances
Impact Canada, Impact & Innovation Unit, Privy Council Office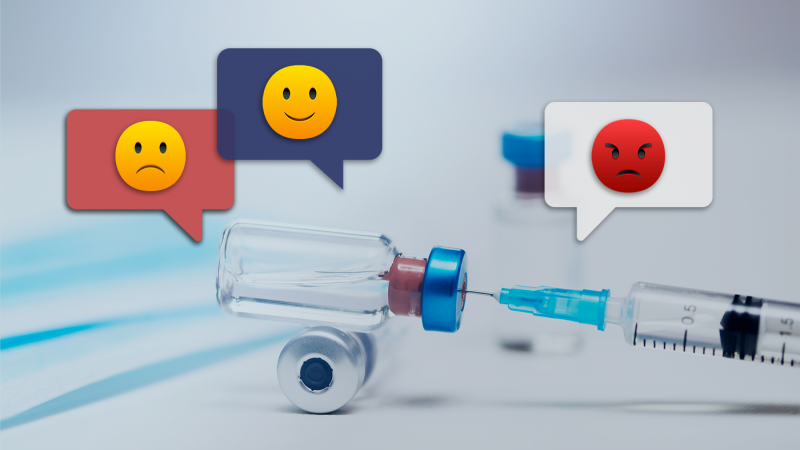
Key Insights
This report focuses on the results for the second wave of this research. 2,129 Canadians aged 18 and older were surveyed between August 13 and 17, 2020. The data was weighted to ensure that the sample distribution reflects the actual Canadian adult population according to Statistics Canada census data. There is no associated margin of error for the results, since a non-probability design means that results cannot be projected to the larger population.
Many Canadians still think that the “worst of the crisis is yet to come”
Up until Wave 5 of the survey, there was a steady increase in the number of respondents who thought “the worst of the crisis is behind us,” however, from Wave 5 to Wave 7 the percentage has declined from 41% to 33%. The percentage of respondents who think that the “worst of the crisis is yet to come” increased from 35% in Wave 5 to 43% by Wave 7. Certain groups are more likely to think that the worst is yet to come. For example, Canadians who were unemployed prior to the crisis are most likely to indicate that the “worst of the crisis is yet to come” (51%) [ see chart ].
Canadians are expecting long-lasting impacts of COVID-19
Canadians are expecting the impacts of COVID-19 to be long-lasting and many Canadians will avoid travelling to the US, going to large gatherings, flying on a plane, and using a ride-sharing service within the next year. Intentions to engage in some activities have decreased as the pandemic progresses. For example, the number of Canadians that think that it is likely that they will fly on a plane decreased from 19% in Wave 3 to 13% by Wave 7, and intentions to attend a large gathering decreased from 14% in Wave 3 to 8% by Wave 7 [ see chart ].
Support for public health measures remains steady
There is strong public support for extending some health measures for six months or longer and these numbers have increased or remained stable across waves. A majority of respondents believe that physical distancing should be extended for 6+ months, indicating that many Canadians are aware that COVID-19 will continue to impact day-to-day life into 2021 [ see chart ].
Trust in government information sources continues to decline
Trust in government information sources has declined since the beginning of the crisis [ see chart ].
Some Canadians are consuming more alcohol than they were prior to the crisis
The majority of respondents (63%) report that their alcohol consumption has remained the same. However, 21% of respondents reported that the number of days that they drink alcohol in a typical week has increased since February [ see chart ].
Vaccine confidence continues to decline, and hesitancy appears to be driven by concerns about a lack of research and testing and the safety and effectiveness of the vaccine
Only 63% of respondents strongly agreed or agreed that they would get a safe vaccine if it becomes available. The number of people who disagree doubled from 6% in Wave 1 to 12% in Wave 5 and remained stable in Wave 6 and Wave 7. Concerns around a lack of research and testing, the safety of a vaccine, and the newness of the vaccine are the most prevalent reasons for not wanting to receive a safe vaccine once developed [ see chart ].
Background
To support federal response efforts, Impact Canada is leading the implementation of the World Health Organization (WHO) Behavioural Insights (BI) Tool on COVID-19 in the Canadian context. This work is led in collaboration with the Public Opinion Research Team within the Privy Council Office’s (PCO) Communications and Consultation Secretariat, which supports the Prime Minister’s Office in coordinating government communications in accordance with key priorities.
Methodology
With a longitudinal design, the study follows 2,000 participants recruited from an online panel over sixteen data collection waves. New participants are added only when an original panelist stops participating.
Respondents are a representative mix of Canadian adults aged 18 years and older and results are weighted using 2016 Statistics Canada census data to mirror the population distribution in Canada.
Selected Figures
A number of selected figures are presented below. For more information on the data set, please contact the Impact and Innovation Unit .
Respondent Profiles
Age
| Canada (n=2,129) | BC/Yukon (n=291) | Alberta (n=241) | Man/Sask (n=138) | Ontario (n=815) | Quebec (n=498) | Atlantic (n=145) | |
|---|---|---|---|---|---|---|---|
| 18-34 years | 27% | 27% | 32% | 29% | 27% | 26% | 23% |
| 35-54 years | 34% | 34% | 36% | 34% | 35% | 33% | 33% |
| 55 years and older | 39% | 40% | 32% | 37% | 38% | 41% | 44% |
Gender
| Canada (n=2,129) | BC/Yukon (n=291) | Alberta (n=241) | Man/Sask (n=138) | Ontario (n=815) | Quebec (n=498) | Atlantic (n=145) | |
|---|---|---|---|---|---|---|---|
| Male | 48% | 48% | 49% | 49% | 48% | 49% | 48% |
| Female | 51% | 52% | 50% | 51% | 52% | 51% | 52% |
| Gender diverse | 0.2% | 0% | 0.7% | 0% | 0.3% | 0% | 0% |
Education
| Canada (n=2,129) | BC/Yukon (n=291) | Alberta (n=241) | Man/Sask (n=138) | Ontario (n=815) | Quebec (n=498) | Atlantic (n=145) | |
|---|---|---|---|---|---|---|---|
| High school or less | 22% | 21% | 20% | 27% | 22% | 20% | 25% |
| College/trades | 51% | 48% | 50% | 53% | 49% | 54% | 56% |
| University / post-graduate | 27% | 31% | 28% | 21% | 29% | 26% | 19% |