Report

Increasing Response Rates to a Statistics Canada Survey

Statistics Canada
Impact Canada, Impact & Innovation Unit, Privy Council Office

a pen lying on a bar chart

Executive Summary

During the past several years, there has been a steady decline in Canadians’ rate of response to the Government of Canada’s mandatory and voluntary surveys. To address this problem, in Spring 2016, Statistics Canada approached the Privy Council Office’s Innovation Hub (the Hub) for consultation on how to increase response rates to these surveys. The Hub designed an experiment using the principles of behavioural insights (BI), a multidisciplinary approach that applies knowledge and tools from the behavioural sciences, including behavioural economics, psychology, and social marketing, to encourage positive changes in behaviour.

Collaborating with a behavioural scientist from the Behavioural Economics in Action Research Centre (BEAR), Rotman School of Management, University of Toronto, the Hub developed two simple, low-cost BI-interventions. The Farm Financial survey, a national mandatory survey, collects critical financial data from about 10,000 farms in total. This data is used to inform Government of Canada policies and programs. Currently, the survey is conducted by phone, after farmers receive an initial notification letter by mail. The experiment involved testing two new notices sent to farmers after the initial notification: a reminder letter and a reminder letter that included a significant process change—a five day deadline to proactively call Statistics Canada to schedule an appointment to complete the survey.

In July 2016, a total of 4,542 farms who had not yet completed the survey were randomly assigned to one of three conditions as part of a randomized controlled trial (RCT): a control group (no reminder letter); a second group (reminder letter); and a third group (reminder letter with the process change). The results of the RCT revealed that the reminder letter with the process change significantly increased the overall national response rate by 6.8 % (% change relative to control), and the provincial response rate by as much as 15.6% (% change relative to control).

This research project demonstrates that it is possible to significantly increase the response rate to a Government of Canada survey leveraging the principles of BI, experimentally validated through a RCT. Statistics Canada is one of the first departments to leverage the power of experimentation to produce better data and evidence-based results to improve service delivery and program outcomes.

This research project demonstrates that it is possible to significantly increase the response rate to a Government of Canada survey leveraging the principles of BI, experimen- tally validated through a RCT. Statistics Canada is one of the first departments to leverage the power of experimenta- tion to produce better data and evidence-based results to improve service delivery and program outcomes.

Introduction

For several years, Statistics Canada has observed a steady decline in the number of individuals and businesses completing Government of Canada mandatory and voluntary surveys. For example, in the last five years, there has been a four percent point decrease in the overall response rate to Statistic Canada’s household surveys. Recognizing a need to explore alternative approaches to encouraging survey responses, Statistics Canada partnered with the Privy Council Office’s Innovation Hub (the Hub) to apply behavioural insights (BI) principles to increase participation in a mandatory, agricultural survey.

After a careful review of a number of Statistics Canada surveys, the decision was made to focus on the Farm Financial Survey for a research project. The Farm Financial Survey, an initiative by Agriculture and Agri-Food Canada and Statistics Canada, provides data on farm assets, liabilities, revenues, expenses, capital investments and capital sales. This infor- mation is critical to examining the effects of federal and provincial agriculture programs and policies on different farm operations. The survey uses the Census of Agriculture to create a list stratified by province, farm type, and farm size. The target population for the survey consists of all active Canadian agriculture operations. Specific farms excluded from this target population include farms with less than $25,000 in sales from agricultural activities, institutional farms, community pastures, farms on First Nations reserves in select provinces, and farms that are part of multi-holding companies. This survey selected a sample size of approximately 10,000 units from the target population.

"Recognizing a need to explore alternative approaches to encouraging survey responses, Statistic Canada partnered with the Privy Council Office’s Innovation Hub (the Hub) to apply behavioural insights (BI) principles to increase participation in a mandatory, agricultural survey."

Participation in the survey by selected farms is mandatory. Currently, selected participants are informed by mail via a notification letter that includes a copy of the paper questionnaire for reference and preparation. Several weeks after the notification letter is sent, Statistics Canada employees call participants to collect data via a 25 minute telephone interview. If a participant declines to answer questions during the first phone contact, Statistics Canada continues to attempt to collect responses until the end of the data collection period. In an effort to reduce the burden on farmers, Statistics Canada offers participants the option of using the respondent’s tax data, acquired from the Canadian Revenue Agency, to complete questions on revenues and expenses.

The Experiment

The Hub worked with a behavioural scientist from the Behavioural Economics in Action Research Centre (BEAR), Rotman School of Management, University of Toronto, to develop an experiment to test the effect of two simple, low-cost behavioural interventions on Farm Financial Survey response rates: a reminder letter; and a reminder letter that includes a process change. The reminder letters incorporated principles of behavioural science, including framing and imposing a deadline, to encourage participants to respond to the survey. An initial notification letter, letting participants know about the survey and asking them to complete it, was sent out in June 2016.

Intervention 1—Soft reminder letter

This version of the reminder letter (see Figure 1) involved a relatively simple “soft” reminder letter, incorporating BI principles such as framing, grouping, and simplification. Extensive research in the field of behavioural science has shown that simplifying processes, incorporating plain language, and grouping concepts together can increase cognitive ease, and result in improved outcomes.

Intervention 2—reminder letter with process change

This version of the reminder letter (see Figure 2) also incorporated framing, grouping, and simplification principles, but also included the addition of a process change. Currently, Statistics Canada phones participants at various times of the day in the hope that they will have time available to complete the survey. With this intervention, participants were given a five-day deadline to proactively call Statistics Canada to schedule an appointment to complete the survey. The idea of encouraging participants to proactively call Statistics Canada to schedule an appointment builds on existing research that shows that individuals are more likely to follow through with an action, such as a medical appointment, if a date and time are scheduled for them. Although pre-scheduling appointments was not an option with the current appointment system, we wanted to test whether encouraging farmers to proactively call to set an appointment time that was convenient for them would have any impact on outcomes. Additionally, existing research in the behavioural sciences shows that imposing a deadline can create a sense of urgency and encourage people to take action. The letter also included a tear-away feature to help prevent missed appointments by encouraging participants to write down the date and time of their appointment.

The randomized controlled trial

A randomized controlled trial (RCT) was designed to test and compare the effectiveness of the two reminder letters against the control group (no reminder letter). On July 14, 2016, a total of 4,542 participants that had not yet completed the Farm Financial Survey were randomly assigned to one of three conditions:

  • Control Group: No Reminder Letter
  • Intervention 1: Soft Reminder Letter
  • Intervention 2: Reminder Letter with Process Change

Figure 1 - Intervention 1

Dear Sir or Madam:

You have been selected to participate in the 2016 Farm Financial Survey. Information gathered from survey participants like you is needed to understand the challenges that farmers face today. Results from the survey will help inform important policy decisions that may affect you and your business.

You cannot be replaced

Farms are carefully selected across Canada using known statistical methods and we cannot replace your farm with another. We are relying on your participation to ensure that the survey results are as accurate as possible.

This survey benefits you because it provides the required evidence to:

  • determine subsidy levels and the prices of agricultural products
  • examine the effects of agriculture programs and policies on different types of farm operations by province
  • study the competitiveness of the agricultural industry.

Participating is easy and secure:

  • An interviewer will contact you to arrange an interview time that is convenient for you - days, evenings or weekends.
  • Under the Statistics Act, all information you provide to Statistics Canada is confidential, and used only for statistical purposes.

For more information, please call 1-XXX-XXX-XXXX (TTY: 1-XXX-XXX-XXXX) or visit www.statcan.gc.ca/survey.

Thank you for your participation in this important survey,

Name
Title
XXXXX

If you have already completed the 2016 Farm Financial Survey, please accept our thanks and disregard this letter.

Figure 2 - Intervention 2

Dear Sir or Madam:

You have been selected to participate in the 2016 Farm Financial Survey. Information gathered from survey participants like you is needed to understand the challenges that farmers face today. Results from the survey will help inform important policy decisions that may affect you and your business.

You need to make an arrangement to complete the survey within 5 days of receiving this letter. To complete it now, or to schedule an appointment at a time that is convenient for you (days, evenings or weekends), please call 1-XXX-XXX-XXXX (TTY: 1-XXX-XXX-XXXX).

This survey benefits you because it provides the required evidence to:

  • determine subsidy levels and the prices of agricultural products
  • examine the effects of agriculture programs and policies on different types of farm operations by province
  • study the competitiveness of the agricultural industry.

Participating is easy and secure:

  • Call 1-XXX-XXX-XXXX to complete the survey now, or to schedule an appointment at a time that is convenient for you – days, evenings or weekends.
  • Under the Statistics Act, all information you provide to Statistics Canada is confidential, and used only for statistical purposes.

For more information, please visit www.statcan.gc.ca/survey.

Thank you for your participation in this important survey,

Name

Title
XXXXX

If you have already completed the 2016 Farm Financial Survey, please accept our thanks and disregard this letter.

-----------------------------------------------------------------------------------------------✂----------------------------------------------------------------------------------------------------------
2016 Farm Financial Survey, Statistics Canada
Appointment scheduled for:

Date:                                                 Time:                                        

Number: 1-XXX-XXX-XXXX (TTY: 1-XXX-XXX-XXXX).

Results

National results

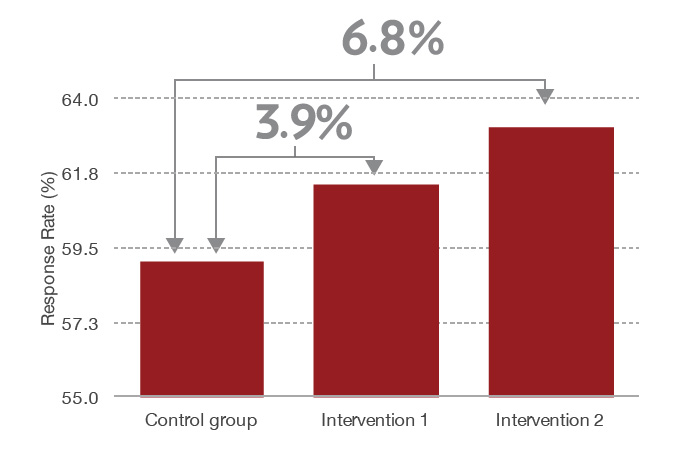
At an aggregate national level, the randomized controlled trial results show that the reminder letter with process change (intervention 2), in which participants were given a five-day deadline to call Statistics Canada to schedule an appointment, significantly increased response rates to the Farm Financial Survey. This intervention increased the overall response rate from 59.1 % (the control) to 63.1 %, a statistically significant (p < .05) increase of 6.8 % relative to control (% change). The soft reminder letter (intervention 1) also had a greater response rate than the control group (61.4 % vs. 59.1 %), but this difference was not statistically significant.

Figure 3. Overall results of the randomized controlled trial
Text version
Group
Response Rate
Increase relative to control group
Control Group
59.1%
N/A
Intervention 1
64.4%
3.9%
Intervention 2
63.1%
6.8%

Provincial results

Broken down by province (see Appendix A), the group receiving the reminder letter with process change (interven- tion 2) performed significantly better than the group receiving no reminder letter (control group) in several provinces: Alberta a 15.6 % increase, British Columbia a 13.9 % increase, and the Atlantic Provinces1 a 13.1 % increase (all % change relative to control). Although not statistically significant, it is important to note that in the province of Quebec, the control group out-performed both interventions 1 and 2, with intervention 2 resulting in a 6.5 % decrease in response rate (% change relative to control). Consideration should be given to exploring the underlying factors that might have led to this difference.

Figure 4. Select Provincial Results of the Randomized Controlled Trial


1 Atlantic provinces were grouped together in order to have a large enough sample size for analysis

Text version
Province
Group
Response Rate
Atlantic Provinces
Control Group
57.8%
Intervention 1
63.0%
Intervention 2
65.4%
Quebec
Control Group
61.7%
Intervention 1
64.9%
Intervention 2
57.9%
Alberta
Control Group
52.4%
Intervention 1
54.2%
Intervention 2
60.6%
British Columbia
Control Group
57.2%
Intervention 1
59.1%
Intervention 2
65.2%

Conclusion

This pilot project with Statistics Canada demonstrates that it is possible to significantly improve Government of Canada survey response rates through experimentation and the use of behavioural insights. In the case of the Farm Financial Survey, on an aggregate national level, the addition of a reminder letter including a process change with a five-day deadline (intervention 2) increased survey completion by 6.8 % relative to not sending a reminder letter. Broken down by province, this same intervention resulted in increases of as much as of 15.6 % relative to the no-reminder condition.

Statistics Canada is one of the first departments to lever- age the power of experimentation to produce better data and evidence-based results to improve service delivery and program outcomes. This study demonstrates that significant positive changes can be achieved using simple, low-cost innovative approaches and interventions.

Appendix A: Table 1 - Provincial test results

Province
Group
Response Rate
RR Confidence Interval
Atlantic Provinces Control Group 57.8% (49.2% - 66.3%)
  Intervention 1 63.0% (54.6% - 71.4%)
  Intervention 2 65.4% (57.8% - 72.9%)
Quebec Control Group 61.7% (55.0% - 68.2%)
  Intervention 1 64.9% (58.2% - 71.4%)
  Intervention 2 57.9% (50.9% - 64.7%)
Ontario Control Group 69.5% (64.3% - 74.7%)
  Intervention 1 71.2% (66.1% - 76.4%)
  Intervention 2 72.4% (67.5% - 77.4%)
Manitoba Control Group 54.1% (46.0% - 62.2%)
  Intervention 1 52.4% (44.8% - 60.0%)
  Intervention 2 54.9% (46.7% - 63.1%)
Saskatchewan Control Group 55.2% (49.0% - 61.3%)
  Intervention 1 59.7% (53.4% - 66.0%)
  Intervention 2 59.6% (53.5% - 65.7%)
Alberta Control Group 52.4% (45.6% - 59.1%)
  Intervention 1 54.2% (47.5% - 61.0%)
  Intervention 2 60.6% (54.3% - 66.9%)
British Columbia Control Group 57.2% (49.5% - 64.9%)
  Intervention 1 59.1% (51.6% - 66.7%)
  Intervention 2 65.2% (57.7% - 72.7%)

*Note: At the significance level α = 5%, the significant difference between the Control Group and others are seen in bold.

Appendix B: Glossary of terms

Term
Definition
Behavioural Insights (BI) A multidisciplinary approach that uses the principles and tools of behavioural economics, psychology, and social marketing to influence behavioural change in a positive way.
Grouping The easier information is to process, the more likely people are to act on it.
Cognitive Ease The easier something is to do, the more likely people are to do it.
Deadlines Imposing a deadline can create a sense of urgency and encourage people to take action.
Framing The particular way in which a request is worded can substantially influence people’s responses.
Implementation Intentions Encouraging people to form a plan to carry out their intentions has been shown to increase the attainment of desired goals in a variety of domains.
Randomized Controlled Trial (RCT) A research method that tests the effectiveness of implementing different types of interventions. By randomly assigning different groups of people to receive different interventions (or no intervention) and comparing these groups, this method provides clear evidence indicating which intervention(s) result(s) in superior outcomes.
Timing Changing the timing of an activity can affect the way in which individuals respond.
Published: 2017-11-21
Last modified: 2024-11-06
Report

Engaging Canadian Women with a Career in the Armed Forces

Impact Canada, Impact & Innovation Unit, Privy Council Office
Female armed forces member working under a fighter jet

Executive Summary

In partnership with the Department of National Defence (DND), the Impact and Innovation Unit (IIU) conducted a marketing trial in an effort to understand what works in advertising aimed at increasing engagement among women with a career in the Canadian Armed Forces (CAF). The trial follows an earlier research project by the IIU which examined qualitative and quantitative data using a behavioural lens in an effort to identify barriers to the recruitment of women and provide recommendations to address those barriers. Behavioural insights (BI) is a multidisciplinary approach that applies knowledge and tools from the behavioural sciences, including behavioural economics, psychology, and social marketing, to encourage positive changes in behaviour.

Seven ads were tested on both Facebook and Instagram in both official languages and unique click through rates (UCTR) were used as a measure of engagement. UCTRs ranged between 0.48% and 1.04% on Instagram and 1.63% and 3.13% on Facebook, in some cases exceeding the industry benchmark engagement rate of approximately 1% for Government of Canada social media advertising. The best performing ads used facts to challenge misconceptions about women in the CAF, delivered a specific value proposition about the benefits of a career in the CAF, or included graphics that evoked traditional and patriotic imagery such as the Armed Forces badge. The trial also tested the importance of conceptual congruence between the images and text in social media advertising. The data suggests that conceptually aligning images and text is associated with increased engagement. There was little difference in engagement between ads when presented in English or French. The highest levels of engagement were measured in Quebec and Central Canada, while the lowest click through rates were seen in Northern Canada. Ads that promoted the CAF’s financial support for education performed better on Instagram than on Facebook. Each ad was designed leveraging behavioural science principles. The ads were viewed over 2.5 million times and differences in UCTR between the ads inform findings that can be used to design future campaigns.

This trial applies behavioural science principles and an experimental approach to marketing designed to help isolate key determinants of the performance of a given ad. Used in conjunction with numerous other efforts underway, this approach can assist DND in achieving its target of 25.1% women members in the CAF by 2026.

Introduction

Recognizing the importance of an inclusive and diverse organization, the Canadian Armed Forces has made a commitment to increase the number of women to comprise a minimum of 25.1% of its workforce by 2026. As of December 2017, achieving this target will require the recruitment of approximately 10,000 women.

A study completed by the Impact and Innovation Unit (IIU) and published in June 2017 focused on three main areas in which behavioural insights can help increase the number of women in the CAF:

  • The recruitment process;
  • Recruitment marketing and communications;
  • And policies and guidelines within the CAF.

To identify possible barriers to the recruitment of women, the IIU examined qualitative and quantitative data from numerous primary and secondary sources through a behavioural lens. This included data examined from surveys conducted with CAF members, jurisdictional analyses, and consultations with experts. Members of the IIU also went through the CAF application process and documented their experiences. Based on these findings, and barriers identified, approximately twenty recommendations were identified.

In addition, the report identified two key areas in which policy and program experimentation techniques could be used to test the effectiveness of CAF messaging targeting both current and potential applicants. The first was identifying the most effective format and process for applicant correspondence. The CAF continues to leverage behavioural insights principles to make the application process better and more inclusive.

The second area was to test the application of behavioural insights to recruitment marketing and identify the most effective messages in driving engagement with a potential CAF career.

Research commissioned by the CAF and DND suggests that familiarity with the CAF as a career choice among Canadians is limited. With this in mind, advertising campaigns like the one in this trial aim to increase overall awareness of the CAF as an employer of choice by delivering messaging not only to potential applicants, but to Canadians in general. The IIU worked with members of the CAF and communications professionals at DND to apply the principles of behavioural science to advertising messages with the aim of generating interest in the career options available.

This trial is innovative in its application of behavioural science principles to advertising but also for the experimental design and approach it employs. The campaign is designed to isolate the discrete effects of particular messages and images by comparing them against other ads. This approach represents a way to better understand what works in advertising through experimentation to ensure that policy objectives can be met.

The Experiment

The IIU and the Department of National Defence, designed and ran a social media marketing trial on two social media platforms – Facebook and Instagram from the weeks of September 18 to October 1, 2017. The objective was to determine best practices to increase engagement among Canadian women with a career in the CAF.

A total of seven ads were designed and tested over the three-week period. The ads were designed taking into account past research conducted by the IIU, knowledge and experiences from DND, and by leveraging behaviourally-informed marketing best practices. Copy and creative were kept as similar as possible across Facebook and Instagram in order to ensure maximum comparability between platforms. Sample sizes and outcome data were designed such that analysis of ads at the provincial and territorial level was possible.

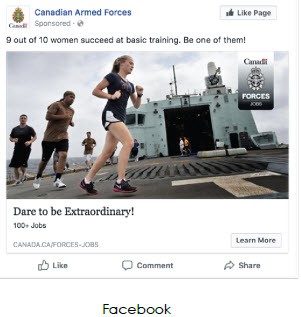
Basic Training (Ad 1) - The IIU’s previous report identified apprehension over basic training as an important barrier to entry for women considering a career in the Armed Forces. This ad uses social norms that are specific to women to help break down the widespread assumptions that underlie the perception that basic training is difficult for women. The previous report identified the physical demands of training as a key concern for women considering a CAF career. The chosen image includes a woman leading men in a physical training exercise and seeks to challenge concerns over relative fitness levels.

Facebook ad by the Canadian Armed Forces that shows individuals running on a ship
Instagram ad by the Canadian Armed Forces that shows individuals running on a ship

Tuition (Ad 2) – The IIU’s previous report identified financial support for education as a key incentive for young women considering a career in the Armed Forces. This message is a value proposition that makes this incentive salient.

Facebook ad by the Canadian Armed Forces that shows a woman sitting in her dormitory
Instagram ad by the Canadian Armed Forces that shows a woman sitting in her dormitory

Badge Neutral (Ad 3) - The badge ad was designed to convey the most neutral message possible. It uses the Armed Forces badge instead of a picture of a service member and this traditional image is meant to evoke a sense of patriotism.

Facebook ad by the Canadian Armed Forces that shows the Canadian Armed Forces badge
Instagram ad by the Canadian Armed Forces that shows the Canadian Armed Forces badge

Challenge (Ad 4) - This ad frames a career in the armed forces as an exciting and challenging lifestyle. The use of ‘exciting challenges’ and the image of a woman in full combat uniform in this ad is intended to reflect this frame.

Facebook ad by the Canadian Armed Forces that shows a woman in uniform carrying a weapon
Instagram ad by the Canadian Armed Forces that shows a woman in uniform carrying a weapon

Humanitarian (Ad 5) – In contrast to ad 4, this ad frames a career in the Armed Forces in terms of helping others. The IIU’s previous research suggests that the humanitarian aspect of a CAF career is appealing to women. The chosen image of a woman helping an infant out of a helicopter during an aid mission is used to reinforce the humanitarian frame.

Facebook ad by the Canadian Armed Forces that shows a female soldier in a helicopter carrying a child
Instagram ad by the Canadian Armed Forces that shows a female soldier in a helicopter carrying a child

Challenge - Neutral Image (Ad 6) - This ad repeats the language from ad 4, with a more neutral picture. This allowed for the isolation of the relative effects of copy and creative in these ads.

Screenshot of Facebook ad by the Canadian Armed Forces that shows a woman in military uniform
Screenshot of Instagram ad by the Canadian Armed Forces that shows a woman in military unfirom

Humanitarian - Neutral Image (Ad 7) - Similar to ad 6, this ad allowed for the isolation of the effects of copy and creative for the humanitarian message.

Screenshot of Facebook ad by the Canadian Armed Forces that shows a woman in military uniform
Screenshot of Instagram ad by the Canadian Armed Forces that shows a woman in military unfirom

The Trial

The campaign used Facebook and Instagram to target a national sample of 18 to 34 year old Canadian women and received over 2.5 million impressions. After a review of social media platforms, Facebook and Instagram were chosen because of their large user base among the target population. The total budget for the campaign was $25,000, which was evenly split between the two platforms. The seven ads provided the basis for two separate tests:

  1. Message Comparison Test (Ads 1-5)

    Ads 1-5 each reflect a different message designed to attract interest in a career in the CAF.

  2. Image Message Congruence (Ads 4-7)

    Ads 4-7 form an experiment which tests the importance of having the images and text in a given ad line up conceptually; how important is it that the image in an ad conveys the same message as the copy in the caption? To answer this question, both the challenge and humanitarian ads were displayed with a congruent picture (the woman holding the gun or the woman carrying the child – ads 4-5) as well as a neutral picture (the woman in the snow - ads 6-7).

    Due to the Facebook and Instagram ad auction system, true randomization was not possible. The ad auction system identifies users eligible to see an ad and then enters them into an auction. Three factors determine which ad wins the auction and is displayed:

    1. Advertiser Bid
      Advertisers bid on how much they would be willing to pay for a given outcome, such as link clinks.

    2. Estimated Action Rates
      Estimated action rates represent how likely Facebook thinks a user is to take action on a particular ad. This is affected by the user’s previous actions.

    3. Ad Quality and Relevance
      The overall quality of an ad as measured by feedback the ad has received in addition to a relevance score based on the users interests.

In order to maintain the validity of the test, we took the following approach:

  • Advertiser bid was manually kept constant across ads
  • Total budget allocated to each ad was kept equal
  • Target population was the same for all ads
  • All ads were designed to be of equal quality and relevance

In this study, engagement with advertising was measured primarily by unique click through rate (UCTR). While UCTR was available at an aggregate national level, it was unavailable for provincial/territorial analysis and so CTR was used instead. UCTR was the preferred metric because it helps avoid double counting if a particular user is repeatedly exposed to and/or clicks on a particular ad. All ads lead to the CAF recruitment page, which has information on a career in the armed forces and how to apply.

Results

Engagement was measured by the proportion of users that clicked through on each ad and differences in these engagement rates inform the findings of this trial. Reach and impressions were approximately equally distributed between the seven ads. UCTRs ranged between 0.48% and 1.04% on Instagram and 1.63% and 3.13% on Facebook, in some cases exceeding the industry benchmark engagement rate of approximately 1% for Government of Canada social media advertising. Complete data on reach, impressions and click through rates are available in Appendix B.

Ad Comparison

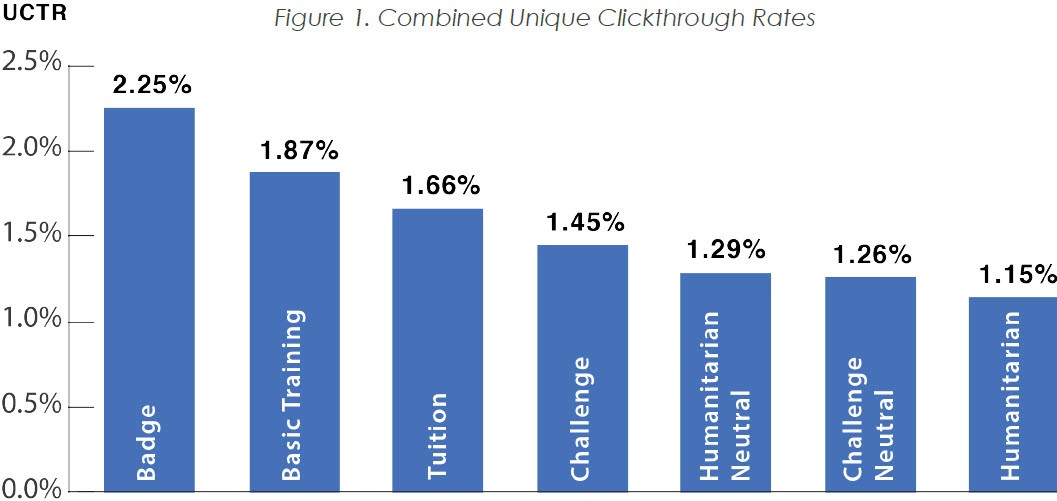
The best performing ads as measured by unique click through rates were the badge, basic training, and tuition ads when combined across both Instagram and Facebook and in English and French. Regardless of whether they were paired with a congruent or neutral image, the challenge and humanitarian ads performed relatively poorly in comparison. (Figure 1)

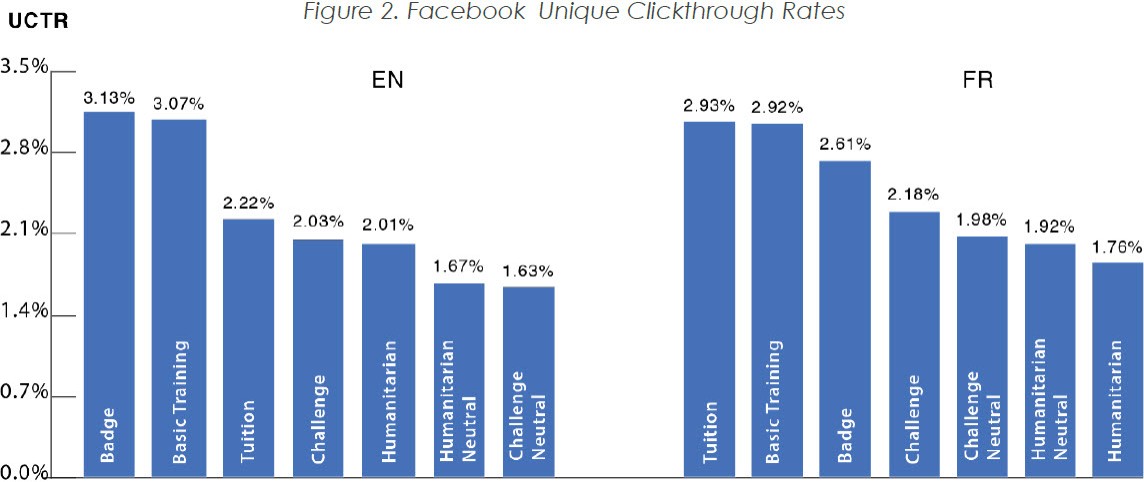
On Facebook, we see a similar pattern as in the combined results, with the badge, basic training, and tuition ads taking the top three spots and the challenge and humanitarian ads performing relatively worse. In relation to the other ads, the tuition ad performed better in French than it did in English. (Figure 2)

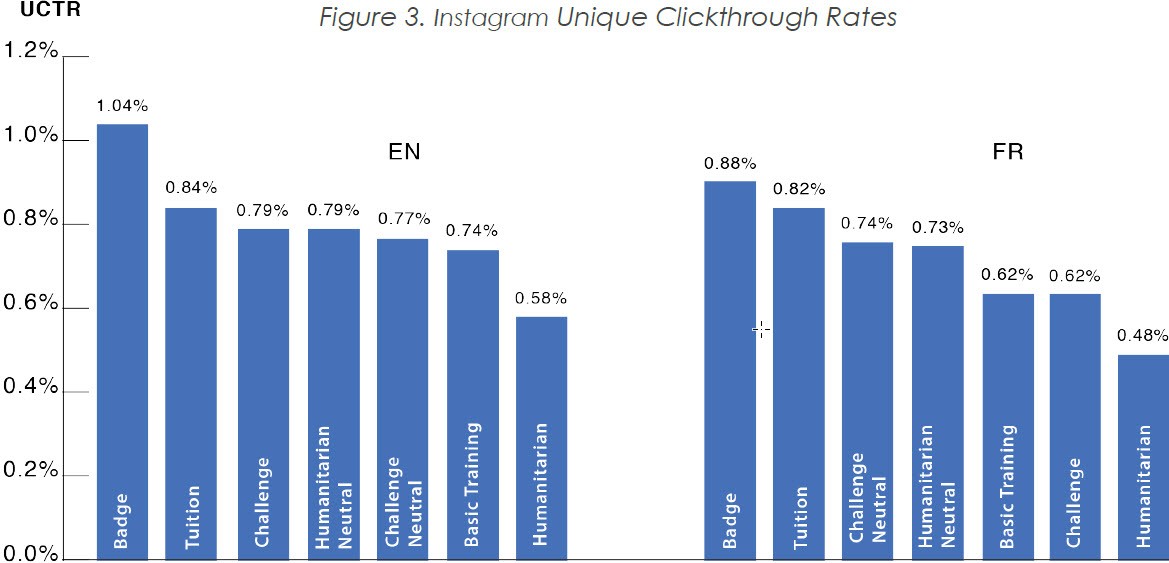
On Instagram, we see that the badge ad achieves a high UCTR and that the tuition ad does considerably better than the basic training ad (EN: p=0.006 FR: p=0.002). In contrast, the humanitarian messaging paired with the congruent picture achieves a particularly low unique click through rate in both languages on Instagram. (Figure 3)

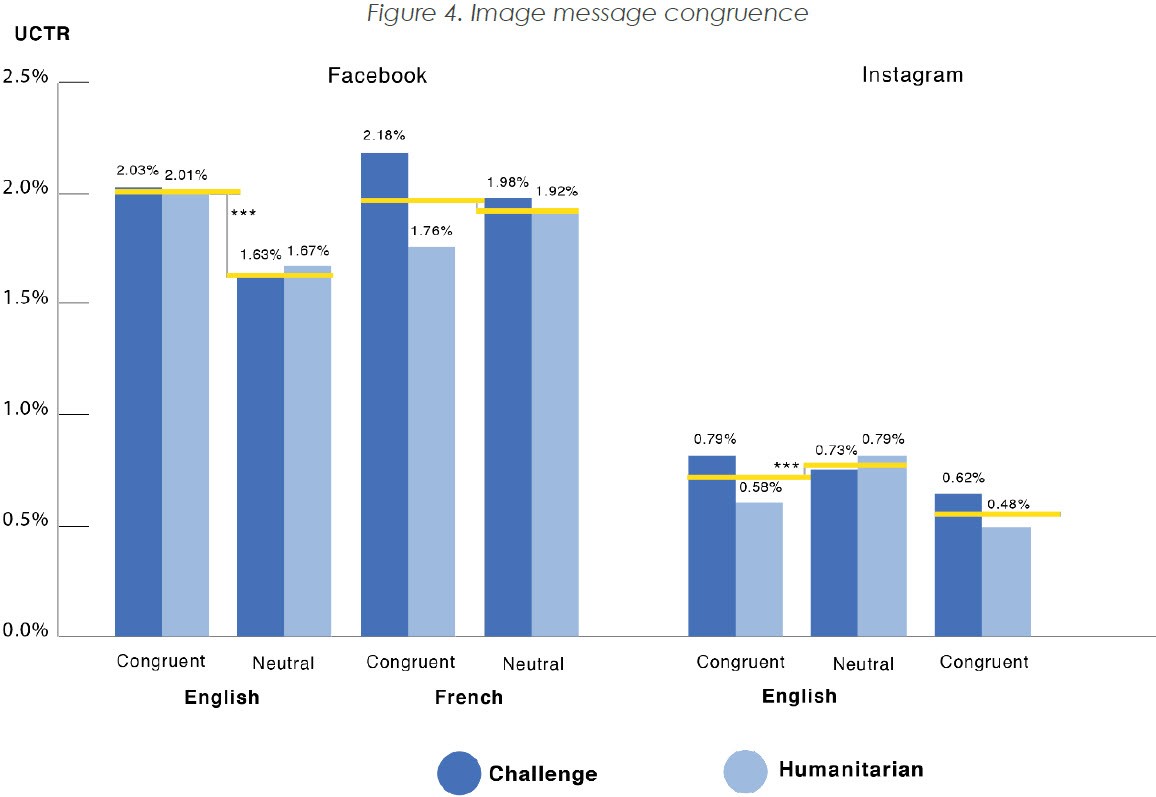
The test of congruence provides evidence that having text and imagery line up conceptually drives engagement with advertising. In the largest sample, English Facebook, there is a statistically significant and meaningful positive difference between the two congruent and two neutral ads (p=0.00). This means that the congruent ads achieved higher UCTRs than their neutral counterparts. In French Facebook, the difference is positive, but not statistically significant. On Instagram, higher UCTRs are not observed for the congruent ads compared to the neutral ads. The null and negative results are primarily driven by particularly low engagement with the humanitarian congruent ad, which was the worst performing ad in this campaign. (Figure 4)

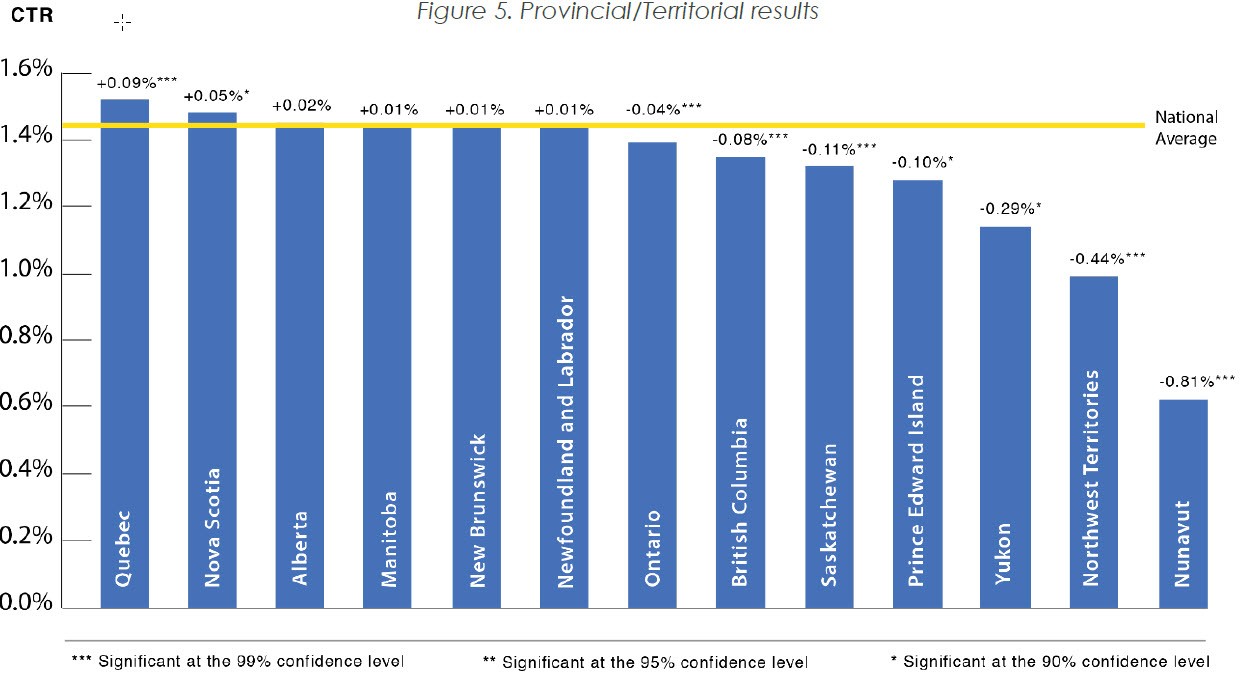
The campaign achieved high levels of engagement in Central Canada and the Maritimes while Ontario and British Columbia were very close to the national average CTR for this trial. Much lower click through rates were observed in the territories. Analysis was conducted to determine if provinces or territories in which the CAF has higher levels of recruitment also engaged with this campaign at higher levels. However, no statistically significant relationship between representation in the CAF and click through rates by province or territory was found. (Figure 5) 

  • Figure 1 - Text description

    Figure showing combined unique clickthrough rates (UCTR). The rate for the Badge ad is 2.25%. The rate for the Basic Training ad is 1.87%. The rate for the Tuition ad is 1.66%. The rate for the Challenge ad is 1.45%. The rate for the Humanitarian Neutral ad is 1.29%. The rate for the Challenge Neutral ad is 1.26%. The rate for the Humanitarian ad is 1.15%.

  • Figure 2 - Text description

    Figure showing unique clickthrough rates (UCTR) on Facebook. The rates for English ads are 3.13% for the Badge ad, 3.07% for the Basic Training ad, 2.22% for the Tuition ad, 2.03% for the Challenge ad, 2.01% for the Humanitarian ad, 1.67% for the Humanitarian Neutral ad, and 1.63% for the Challenge Neutral. The rates for French ads are 2.93% for the Tuition ad, 2.92% for the Basic Training ad, 2.61% for the Badge ad, 2.18% for the Challenge ad, 1.98% for the Challenge Neutral ad, 1.92% for the Humanitarian Neutral ad, and 1.76% for the Humanitarian ad.

  • Figure 3 - Text description

    Figure showing unique clickthrough rates (UCTR) on Instagram. The rates for English ads are 1.04% for the Badge ad, 0.84% for the Tuition ad, 0.79% for the Challenge ad, 0.79% for the Humanitarian Neutral ad, 0.77% for the Challenge Neutral ad, 0.74% for the Basic Training ad and 0.58% for the Humanitarian ad. The rates for French ads are 0.88% for the Badge ad, 0.82% for the Tuition ad, 0.74% for the Challenge Neutral ad, 0.73% for the Humanitarian Neutral ad, 0.62% for the Basic Training, 0.62% for the Challenge ad, and 0.48% for the Humanitarian ad.

  • Figure 4 - Text description

    Figure comparing the unique clickthrough rates (UCTR) of congruent versus neutral Challenge and Humanitarian ads. For English ads on Facebook, the congruent Challenge ad had a UCTR of 2.03% and the congruent Humanitarian ad had a UCTR of 2.01%. The neutral Challenge ad had a UCTR of 1.63% and the neutral Humanitarian ad had one of 1.67%. There is a statistically significant difference between the two congruent and two neutral English ads (significant at the 99% confidence level).

    For French ads on Facebook, the congruent Challenge ad had a UCTR of 2.18% and the congruent Humanitarian ad had a UCTR of 1.76%. The neutral Challenge ad had a UCTR of 1.96% and the neutral Humanitarian ad had one of 1.92%.

    For English ads on Instagram, the congruent Challenge ad had a UCTR of 0.79% and the congruent Humanitarian ad had one of 0.58%. The neutral Challenge had a UCTR of 0.73% and the neutral Humanitarian ad has one of 0.79%. There is a statistically significant difference between the two congruent and two neutral English ads (significant at the 99% confidence level).

    For French ads on Instagram, the congruent Challenge ad had a UCTR of 0.62% and the congruent Humanitarian ad had a UCTR of 0.48%.

  • Figure 5 - Text description

    Figure showing click through rates (CTR) for the campaign by province or territory. The national average is just over 1.4%. The rates for Quebec (+0.09%, significant at the 99% confidence level), Nova Scotia (+0.05%, significant at the 90% confidence level), Alberta (+0.02%), Manitoba (+0.01%), New Brunswick (+0.01%), and Newfoundland and Labrador (+0.01%) were above this average. The rates for Ontario (-0.04%, significant at the 99% confidence level), British Columbia (-0.08%, significant at the 99% confidence level), Saskatchewan (-0.11%, significant at the 99% confidence level), Prince Edward Island (-0.10%, significant at the 90% confidence level), Yukon (-0.29%, significant at the 90% confidence level), Northwest Territories (-0.44%, significant at the 99% confidence level), and Nunavut (-0.81%, significant at the 99% confidence level) were below this average.

Findings

Badge Ad's Strong Performance

The badge ad (Ad 3) achieved a top three unique click through rate in all platforms and languages. Although further testing is required to isolate the determinants of this ad’s success, possible reasons might be that users identified with the regalia of the badge itself which may have evoked patriotic sentiments, or that including the Government of Canada logo drove engagement. The badge may also look different than other ads on the platforms, resulting in it standing out from other images.

Challenge Assumptions and Propose Value

The success of the basic training (Ad 1) and tuition (Ad 2) ads suggest that social media marketing campaigns that challenge assumptions or make a specific value proposition about a career in the armed forces are effective in driving engagement. Social media might be an ideal platform for challenging assumptions about a career in the CAF with facts and statistics in particular because it allows users to engage with that messaging through liking, sharing, and commenting.

In addition, the specific value proposition of subsidized tuition performed considerably better than the more general framing of the challenging or humanitarian nature of a career in the CAF. This finding suggests that more specific value propositions are one way of increasing engagement with social media campaigns.

Congruence Matters

The results of the congruence test suggest that congruent image-message combinations are better than having a neutral image with a given message. On English Facebook, a statistically significant positive effect of congruence was observed for both the challenge (Ads 4, 6) and humanitarian ads (Ads 5, 7). However, results from other platforms and languages suggest that congruence is not the only thing that matters.

The congruent humanitarian picture (Ad 5) in particular resulted in low levels of engagement, despite the fact that it was conceptually in line with the message in the text. Pre-testing images for use in future campaigns is a way of mitigating this issue.

Challenge Versus Humanitarian

While previous research has found that the use of words like ‘challenge’ and ‘exciting’ is likely to result in lower engagement from women with job ads, the results of this study suggest that this finding may not be universal. Overall, the messaging that framed a career in the CAF as challenging and exciting performed considerably better than copy and creative that framed a CAF career as a way to help and protect others, which is language that has been traditionally thought to resonate with women.

Instagram and Facebook

The relative performance of ads was similar on Facebook and Instagram, with the exception of the tuition and basic training ads. The tuition ad drove engagement more effectively on Instagram, which may be reflective of Instagram's younger demographic and the fact that the campaign was conducted at the beginning of the academic year. For this campaign, advertising on Facebook was cheaper than advertising on Instagram, and advertising in French was cheaper than advertising in English.

Conclusion

In partnership with the Department of National Defence, the Impact and Innovation Unit conducted a social media marketing trial with the aim of identifying best practices in driving engagement with a career in the CAF among Canadian women aged 18 to 34. The ads were displayed over 2.5 million times on Facebook and Instagram, and in both English and French.

Overall, click through rates for all the ads on Instagram and Facebook suggest high levels of engagement with the CAF and differences in these rates support evidence-based insights for future campaigns. The best performing ads either provided a specific value proposition to potential recruits, challenged assumptions about a career in the Armed Forces, or made use of the CAF badge and regalia. The trial also found that conceptual congruence between images and text in social media advertising is associated with higher levels of engagement. There were minimal differences in engagement patterns in French and English. However, there were large and significant differences in engagement among provinces and territories. High engagement was measured in Central Canada and the Maritimes, while Northern Canada displayed relatively low levels of engagement.

Applying experimental techniques to Government of Canada advertising campaigns is an effective way of improving marketing outcomes. Designing campaigns with built-in comparison cases and comparing outcome measures between ads in order to create an evidence base of what works would allow the government to improve value by making advertising more effective in achieving its goals. Future testing in the area of CAF recruitment could involve other social media platforms, like Twitter and LinkedIn, as well as applying experimentation techniques to advertising beyond social media. Social media advertising is one tool to increase engagement among Canadian women with a career in the Armed Forces, and is being used in conjunction with many other approaches to achieve the ultimate goal of recruiting more women into the organization.

The IIU would like to thank our colleagues at the Department of National Defence and the Canadian Armed Forces for making this trial possible. This trial, and the IIU’s previous report, is part of a larger ongoing effort to achieve greater gender equality in the CAF that the IIU is proud to support.

Appendix A 

Glossary of Terms

Behavioural Insights (BI):  A multidisciplinary approach that uses the principles and tools of behavioural economics, psychology, and social marketing to influence behavioural change in a positive way.

Clickthrough Rate (CTR): CTR is calculated by dividing the number of clicks each ad receives by the number of impressions.

Unique Clickthrough Rate (UCTR): UCTR is calculated by dividing the number of unique users that click on an ad by the number of unique users that are exposed to the ad.

Impressions: Impressions are the total number of times an ad is displayed.

Reach: Reach is the total number of unique users exposed, at least once, to an ad.

Appendix B

Facebook
  English French
Ad Unique Clicks Reach UCTR 95% Confidence Interval Unique Clicks Reach UCTR 95% Confidence Interval
Basic Training 3819 124469 3.07% [2.97%; 3.16%] 1190 40762 2.92% [2.57%; 3.08%]
Badge 4328 138346 3.13% [3.03%; 3.22%] 1068 40923 2.61% [2.70%; 3.02%]
Tuition 2857 128693 2.22% [2.13%; 2.30%] 1180 40282 2.93% [2.76%; 3.09%]
Challenge 2601 127983 2.03% [1.95%; 2.10%] 866 39793 2.18% [2.03%; 2.31%]
Humanitarian 1897 94517 2.01% [1.91%; 2.09%] 547 31034 1.76% [1.61%; 1.90%]
Challenge - Neutral 2140 131027 1.63% [1.56%; 1.70%] 665 33574 1.98% [1.83%; 2.12%]
Humanitarian - Neutral 2092 125102 1.67% [1.60%; 1.70%] 751 39040 1.92% [1.78%; 2.05%]
Instagram
  English French
Ad Unique Clicks Reach UCTR 95% Confidence Interval Unique Clicks Reach UCTR 95% Confidence Interval
Basic Training 992 134311 0.74% [0.62%; 0.78%] 203 32972 0.62% [0.53%; 0.70%]
Badge 943 90640 1.04% [0.97%; 1.10%] 172 19537 0.88% [0.74%; 1.01%]
Tuition 958 114583 0.84% [0.78%; 0.88%] 281 34461 0.82% [0.70%; 0.91%]
Challenge 939 118740 0.79% [0.74%; 0.84%] 196 31772 0.62% [0.53%; 0.70%]
Humanitarian 763 131923 0.58% [0.53%; 0.61%] 173 36252 0.48% [0.40%; 0.54%]
Challenge - Neutral 856 110733 0.77% [0.72%; 0.82%] 274 37257 0.74% [0.60%; 0.82%]
Humanitarian - Neutral 834 105076 0.79% [0.74%; 0.84%] 266 36199 0.73% [0.64%; 0.82%]
Provincial Results
  Impressions Clicks CTR 95% Confidence Interval
Alberta 342,903 4,958 1.45% [1.40%; 1.85%]
British Columbia 287,842 3,873 1.35% [1.30%; 1.38%]
Manitoba 139,260 2,007 1.44% [1.38%; 1.50%]
New Brunswick 73,394 1,057 1.44% [1.35%; 1.56%]
Newfoundland and Labrador 39,130 563 1.44% [1.32%; 1.55%]
Northwest Territories 7,766 77 0.99% [0.70%; 1.21%]
Nova Scotia 95,016 1,405 1.48% [1.40%; 1.55%]
Nunavut 6,295 39 0.62% [0.42%; 0.81%]
Ontario 854,394 11,846 1.39% [1.36%; 1.47%]
Prince Edward Island 14,165 182 1.28% [1.09%; 1.47%]
Quebec 771,511 11,710 1.52% [1.49%; 1.54%]
Saskatchewan 126,395 1,664 1.32% [1.25%; 1.37%]
Yukon 4,213 48 1.14% [0.08%; 1.45%]
Published: 2018-08-01
Last modified: 2024-11-17
Report

Increasing Take-Up of the Canada Learning Bond

Impact Canada, Impact & Innovation Unit, Privy Council Office
Students

1. Executive Summary

The Canada Learning Bond (CLB) is an educational savings incentive that provides children from low income families born in 2004 or later with financial support for post-secondary education. Personal contributions are not required to receive the CLB, however take-up remains low among the eligible population. The Impact and Innovation Unit (IIU), in collaboration with the Learning Branch and the Innovation Lab at Employment and Social Development Canada (ESDC) conducted a randomized controlled trial to test the effectiveness of behavioural insights (BI) in correspondence sent to primary caregivers of children eligible for the CLB. Letters were modified with the use of behaviourally-informed additions in order to encourage primary caregivers to open a Registered Education Savings Plan (RESP) for their child or children and to receive the CLB.

The trial tested two different base letters (standard and modified) as well as three behaviorally-informed additions designed to mitigate behavioural barriers to take-up of the CLB. The standard letter is currently used by the Learning Branch at ESDC to encourage take-up of RESPs and the CLB. The modified letter used altered content and design to make benefits of the CLB more salient. Each of these letters was sent in its base form, as well as with each of three additions that use behavioural insights to encourage CLB take-up. These additions were:

  1. Imagery and accompanying text (“this day will come sooner than you think”) designed to help parents to picture their child’s graduation to make the benefits of the CLB feel closer
  2. A mock cheque designed to make the CLB tangible in a physical form that primary caregivers are familiar with
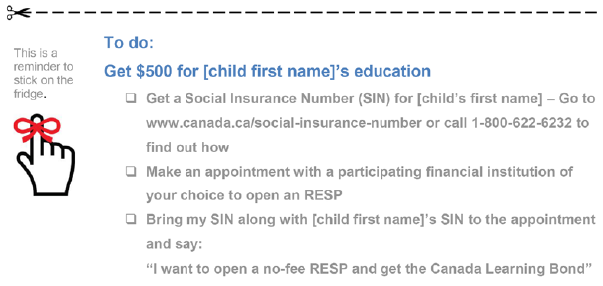
  3. A checklist designed to provide a concrete call to action to request the CLB

The trial found that approximately 5% of primary caregivers opened an RESP and requested the CLB without receiving a letter. On average, sending a letter increased take-up rates to between 8-9% and the best performing letters resulted in take-up rates above 14%. There was no statistically significant difference in CLB take-up rates between the groups that received the standard or modified letter.

In addition, it was found that primary caregivers who have one or more children that are newly eligible for the CLB had higher take-up rates overall than those whose children were all previously eligible and have received correspondence for all of their children in the past. These groups also responded to the letters differently. The most effective letter addition for the previously eligible population was the mock cheque, which tripled CLB take-up in that population relative to not receiving a letter. Primary caregivers of newly eligible children responded best to the checklist, which provided a call to action and broke down the steps to open an RESP and request the CLB. Both results are statistically significant at the 90% confidence level.

This trial demonstrates the effectiveness of BI interventions tailored to the particular behavioural barriers that affect specific populations in increasing take-up of programs like the CLB. If scaled across the eligible population, the best performing letter would result in thousands more children receiving this education savings incentive on an annual basis. Beyond this trial, ESDC uses direct mailings in its efforts to raise awareness of education savings incentives. At least four times per year, letters are sent to primary caregivers from low-income families to inform them that their child is eligible to receive the CLB with information on how to request it on their behalf. The results of this trial will be used to enhance the letters sent to primary caregivers of eligible children in current and future mailings. This letter routinely undergoes iterations to improve its effectiveness, through findings from previous trials and through feedback from partners and stakeholders that ESDC collaborates with in its outreach activities.


2. Introduction

The Canada Learning Bond (CLB) is an education savings incentive administered by Employment and Social Development Canada (ESDC). It is designed to encourage and reinforce the importance of saving for a child’s postsecondary education through Registered Education Savings Plans (RESP). Eligible children from low-income families can receive $500 upon opening an RESP at a participating organization, such as a bank, credit union, or group scholarship plan dealer, and applying for the CLB. Children who remain eligible continue to accumulate $100 in their RESP every year until they turn 15, for a maximum total value of $2,000. No contributions are required for the CLB, but individuals that contribute to an RESP can also receive additional education savings incentives such as the Canada Education Saving Grant (CESG). More information about RESPs and its associated education savings incentives can be found here.

The Impact and Innovation Unit (IIU), in collaboration with the Learning Branch and the Innovation Lab at ESDC conducted a trial to test the effectiveness of correspondence sent to primary caregivers of children who are eligible for the CLB, but have not yet received it. Letters were modified with the use of behaviourally-informed additions to encourage primary caregivers to open RESPs in order for children under their care to receive the CLB.

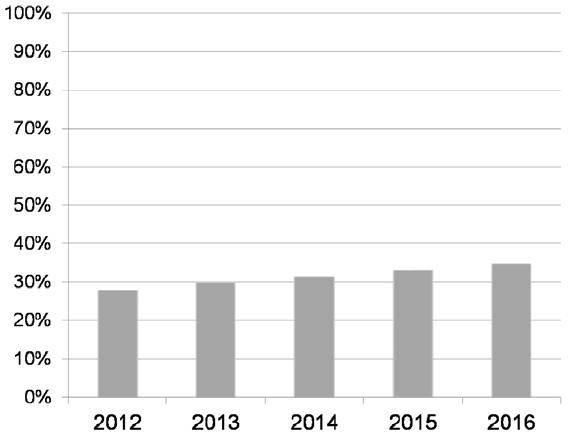
Although ESDC provides incentives to encourage postsecondary educational savings for children from low-income families, only 34.7% of eligible children received the CLB as of 2016 (see figure 1).

Approximately 1.81 million eligible children have yet to receive the CLB. Increasing uptake of the CLB and other government benefits for low-income families is a key priority for the Government of Canada. This trial is part of a larger research portfolio led by the IIU and ESDC that seeks to understand and address barriers to benefit uptake among low-income families.

Program Descriptions


Canada Learning Bond – an education savings incentive that provides up to $2,000 into the RESPs for eligible children from low-income families. For more information, see here.

Canada Education Savings Grant – an education savings incentive where the Government of Canada matches a percentage of annual personal contributions made to an RESP. For more information, see here.

Registered Education Savings Plan – a savings account registered by the Government of Canada to help individuals save money for a child’s post-secondary education. RESPs allow savings for a child’s future studies to grow tax-free, until a child enrolls in full-time or part-time studies in an apprenticeship program, trade school, CEGEP, college, or university. The Canada Learning Bond and the Canada Education Savings Grant can only be accessed through the RESPs. Anyone can open an RESP account and name a child as beneficiary – parents, guardians, grandparents, other relatives or friends. The funds can be used to help with the costs of tuition, housing, and other education-related expenses. More information on RESPs can be found here.


3. Barriers to Enrolment

Through research conducted by ESDC, IIU, as well as community-based and research organizations, 1, 2, 3, 4 a set of behavioural barriers have been identified that may be responsible for low uptake of the CLB among the eligible population.

Misperceptions About RESPs

Some primary caregivers of eligible children might wrongly think it is necessary to contribute funds to an RESP in order to receive the CLB. Research also suggests that some primary caregivers think that RESPs can only be used to cover tuition for universities and colleges, limiting the program’s perceived utility, while RESP funds can also be used for other educational expenses like housing, books and transportation.

Process Barriers

Opening an RESP currently requires a Social Insurance Number (SIN) for both the primary caregiver and the child. In addition, opening an RESP often requires primary caregivers to go to the physical location of an RESP promoter, such as a bank or credit union, because online or telephone sign-up is limited.

Subjective Distance

The benefits of the education savings incentive (supporting child’s post-secondary education) may feel distant in time and difficult to visualize, while the costs of enrolment are in the present. This may result in myopic decision-making that postpones completing the steps required to request the CLB.

Low Awareness of the CLB

Although low-income families tend to be aware of RESPs in general, their awareness of the CLB and understanding of its benefits tend to be very low.


Figure 1 - National CLB Participation Rate

Text version - Figure 1

Graph showing national CLB participation rates by year. The rate in 2012 was just under 30%. The rate in 2013 was about 30%. The rate in 2014 was slightly above 30%. The rate in 2015 was also just above 30%. The rate in 2016 was closer to 35%.


4. Trial Design

Approach and Methodology

A randomized controlled trial (RCT) was conducted, in which primary caregivers of CLB eligible children received different versions of the letter informing them about the CLB and encouraging them to open an RESP to receive it. Letters were sent out in February 2017.

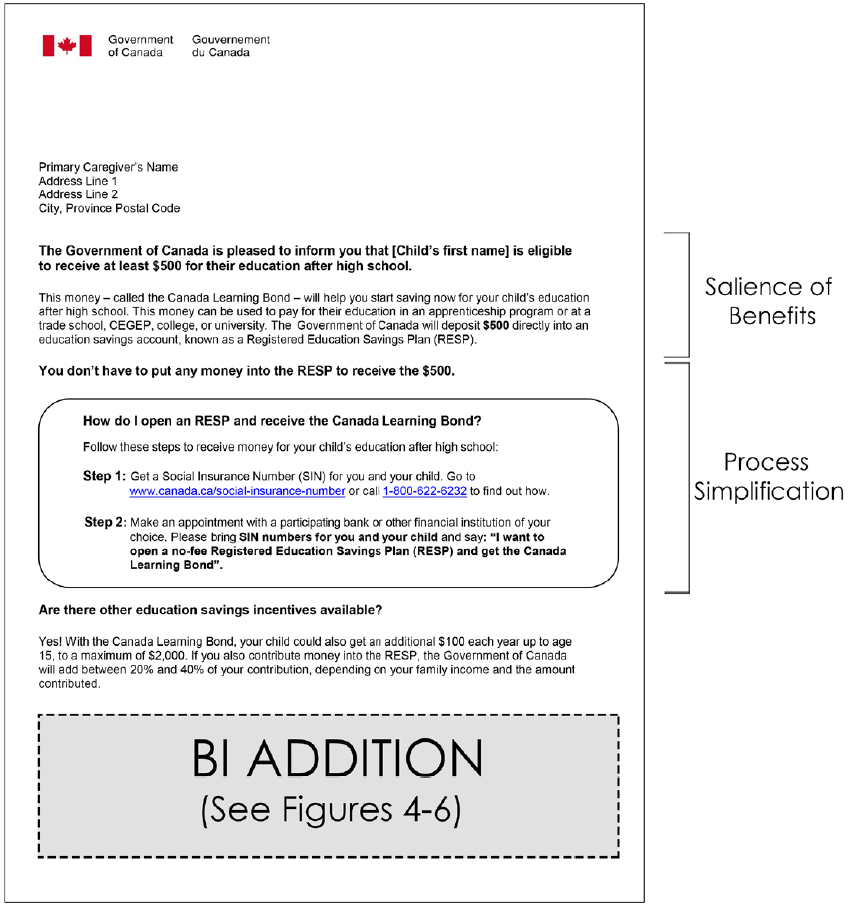
The trial tested two different base letters as well as three behaviourally-informed additions designed to mitigate some of the behavioural barriers. The standard letter (figure 2) is currently used by the Learning Branch at ESDC to encourage take-up of the RESP and CLB and is the control condition for this trial. The modified letter (figure 3) uses altered content and design to make benefits of the CLB more salient. Each of these letters were sent in its base form, as well as with each of three additions designed to mitigate the barriers listed above (figures 3-5).

The trial sought to understand the causal impact of behaviourally informed correspondence on CLB uptake. To this end, CLB take-up was evaluated in August 2017, six months after the letters were sent, in order to ensure sufficient time for primary caregivers to open an RESP and request the CLB. Data provided by ESDC was analyzed by ESDC’s Innovation Lab to assess the effectiveness of the letters on CLB take-up and determine which messages were most effective.

A stratified random sampling method was used to ensure an approximately equal number of primary caregivers with newly eligible children as well as those who have previously eligible children only.


Newly Eligible – A child is considered newly eligible for the CLB when they meet the eligibility criteria for the first time. The primary caregivers of newly eligible children would not have received mail correspondence regarding the CLB for their newly eligible children from the Government of Canada before this trial.

Previously Eligible – Primary caregivers with children that have been previously eligible for the CLB would have been sent mail correspondence from the Government of Canada when they first became eligible for the education savings incentive.

Approximately 50% of primary caregivers were selected with at least one child that was newly eligible for the CLB, whereas the other 50% of primary caregivers had only previously eligible children. On average, children that have been previously eligible for the CLB are older than their newly eligible counterparts. In total, the sample included 42,479 primary caregivers and 69,430 CLB-eligible children.

Primary caregivers were randomly assigned into nine groups, with approximately 4,720 primary caregivers per group. Randomization was done at the primary caregiver level, in order to ensure primary caregivers with multiple children would receive identical letters from the same experimental condition (letter group) for all of their eligble children:

Group Number of letter recipients
1 Standard letter (Control) 4,722
2 Standard letter + image 4,729
3 Standard letter + cheque 4,736
4 Standard letter +checklist 4,719
5 Modified letter 4,699
6 Modified letter + image 4,710
7 Modified letter + cheque 4,724
8 Modified letter + checklist 4,721
9 No letter 4,719
  Total 42,470

Letters and Additions

Figure 2 - Standard

Text version - Figure 2

The standard letter sent by the Learning Branch at ESDC. Content includes a statement that the recipient’s child is eligible for the CLB, facts about the RESP, three steps to open an RESP, and information about other available education savings incentives.


Figure 3 - Modified Letter

Text version - Figure 3

The modified letter sent by ESDC. It resembles the standard letter but the benefits of the CLB and RESP have been made more salient. The number of steps to open an RESP is also reduced from three to two.


Figure 4 - Addition 1: Imagery - Subjective Distance Reduction

Text version - Figure 4

The first BI addition to the letter. On the left-hand side is an image of a group of men and women in graduation gowns and caps, holding diplomas. On the right-hand side is text saying “This day will come sooner than you think! Help make their future bright by opening an RESP. Receive at least $500 to support your child’s education after high school.”


Figure 5 - Addition 2: Cheque - Highlights Potential Loss of Tangible Benefits

Text version - Figure 5

The second BI addition to the letter. It is a mock check in the amount of $500 made out in the name of the letter recipient’s child, with the memo “for education after high school.”


Figure 6 - Addition 3: Checklist - A Concrete Call to Action

Text version - Figure 6

The third BI addition to the letter. It is a checklist with the following steps for “getting $500 for [child first name]’s education]: get a social insurance number (SIN) for [child first name]--go to www.canada.ca/social-insurance -number or call 1-800-622-6232 to find out how, make an appointment with a participating financial institution of your choice to open an RESP, bring my SIN along with [child first name]’s SIN to the appointment and say “I want to open a no-fee RESP and get the Canada Learning Bond.”


Behavioural Science Rationale

The modified letter and each of the additions were created to address the behavioural barriers. While the letter itself acts as a reminder of the CLB, the changes to the letters were designed to address the other barriers described above: misconceptions about the CLB and RESPs, process barriers, and subjective distance.

Standard Letter - The standard letter, which is the letter that was used by ESDC in its direct mailings to primary caregivers of eligible children from low-income families at the time of this trial, is well-designed and has evolved over time to be consistent with a number of behavioural science principles. For example, the letter is short and concise, and it is personalized with the child’s name. It communicates the benefits of the education savings incentive and presents the information in a structured manner. The sign-up process is broken down into steps and emphasis is placed on the steps by enclosing them in a box. This letter continues to undergo enhancements through incorporating the findings from this and previous trials, as well as through feedback from partners and stakeholders that ESDC collaborates with in its outreach efforts.

Modified Letter – In the modified letter, the benefits of the CLB and RESPs were brought to the first section of the letter so that they would be more salient and easier for people to read 5. The first section of the modified letter emphasized that the money can be used to pay for post-secondary education in apprenticeships, trade school, or CEGEP in addition to college and university, and that beneficiaries can get up to $2,000. In the box outlining the steps needed to open an RESP, the modified letter framed the process as a two- (vs. three-) step process to reduce the perceived complexity of the process.

Imagery – The image and accompanying text (“this day will come sooner than you think”) in this addition were designed to make the child’s enrolment in post-secondary education feel closer in time for the primary caregivers reading the letter. Imagery can facilitate the processing of the benefits of receiving the CLB and enable parents to picture their child in that situation (high school graduation). By making the benefits of the education savings incentive feel closer and more salient, it was hypothesized that primary caregivers would be more motivated to open an RESP for their child.

Cheque – The mock cheque was designed to make the benefits of the education savings incentive appear more tangible in a physical form that recipients are already familiar with. The accompanying text and the form of the cheque use the principle of loss aversion to frame non-take-up as the loss of a benefit to the recipient. The cheque was for illustrative purposes only and could not be deposited at an organization that offers RESPs, such as a bank, scholarship plan dealer or insurance company. Above the cheque was a dotted line and scissors to indicate that this section could be torn away and kept as a reminder.

Checklist – The checklist was designed to help potential recipients navigate the process of enrolment by providing them with a concrete call to action 6. The checklist not only provides information on the steps that need to be completed to open an RESP and request the CLB, but also provides instructions on how to complete those steps. The checklist was also meant as a tear-away to be kept as a reminder by the recipient.

Results

How Effective Were the Letters at Increasing the Take-up of the CLB?

Receiving any one of the letters significantly increased the take-up of the CLB versus not receiving a letter at all. Without receiving a letter, approximately 5% of primary caregivers signed up for the CLB. Sending a letter resulted in an additional 3 to 4% increase in the CLB take-up rate, for a total of 8 to 9% of primary caregivers signing up. There was no statistically significant difference between take-up rates between the standard and modified letters (see Figure 7).

Newly Versus Previously Eligible

CLB take-up rates were significantly higher among primary caregivers with at least one newly eligible child than primary caregivers who had only previously eligible children. Without receiving any letters, approximately 9% of primary caregivers with newly eligible children signed up for the CLB. The highest performing letter (group 4) resulted in 14% of primary caregivers signing up for the CLB for their children, which is a percentage increase of over 50% over the standard letter without the additions.

In contrast, primary caregivers with only previously eligible children who did not receive a letter during this trial had a CLB take-up rate of approximately 2%. The highest performing letters (group 3) resulted in 6% of primary caregivers signing up for the CLB, effectively tripling the CLB take-up rate in this population.

Figure 7 - Comparing Take-up with the Standard vs. Modified Letter (combined newly and previously eligible)

Text version - Figure 7

This graph shows overall CLB take-up by recipients of the standard letter (groups 1-4), modified letter (groups 5-8), and no letter (group 9). Recipients of the standard letter had a take-up rate of 9%. Recipients of the modified letter had a take-up rate of 8.60%. People who did not receive a letter had a take-up rate of 5.21%.


Which Letters Worked Best for Newly Eligible?

While sending a letter increased take-up, the checklist was the most effective addition for primary caregivers that had at least one newly eligible child in their care (see figure 8). 8


Figure 8 - Comparing Take-up with the Different Letter Variations for the Newly Eligible Group

Text version - Figure 8

This graph compares CLB take-up among newly eligible caregivers according to the letter variation they received. Those having received the standard letter (i.e. control group) had a take-up rate of 12.3%. Recipients of the standard letter with the image had a rate of 12.4%. Recipients of the standard letter and cheque had a rate of 13.3%. Recipients of the standard letter and checklist had a rate of 14.2%. Recipients of the modified letter had a rate of 12.8%. Recipients of the modified letter and image had a rate of 11.6%. Recipients of the modified letter and cheque had a rate of 11.6%. Recipients of the modified letter and checklist had a rate of 13.1%. Recipients of no letter had a rate of 8.6%. The standard letter and checklist was the best performing.


Which Letters Worked Best for Previously Eligible?

While sending a letter increased take-up, adding a cheque to the letter was the most effective addition for primary caregivers that had only previously eligible children in their care (see figure 9). 9


Figure 9 - Comparing Take-up with the Different Letter Variations for the Previously Eligible Group

Text version - Figure 9

This graph compares CLB take-up among previously eligible caregivers according to the letter variation they received. Those having received the standard letter (i.e. control group) had a take-up rate of 5.0%. Recipients of the standard letter with the image had a rate of 4.7%. Recipients of the standard letter and cheque had a rate of 6.1%. Recipients of the standard letter and checklist had a rate of 5.2%. Recipients of the modified letter had a rate of 4.8%. Recipients of the modified letter and image had a rate of 4.7%. Recipients of the modified letter and cheque had a rate of 5.7%. Recipients of the modified letter and checklist had a rate of 5.1%. Recipients of no letter had a rate of 2.1%. The standard letter and cheque, as well as the modified letter and cheque, were the best performing.


Results Summary

Overall, the checklist worked best for primary caregivers with at least one newly eligible child, whereas the cheque worked best for primary caregivers with only previously eligible children. Both the checklist and cheque were tear-away additions to the letter that served as reminders to get the CLB; however, they addressed different behavioural barriers. The cheque made the benefit of the incentive tangible and highlighted what primary caregivers would have missed out on if they did not sign-up. The checklist was more effective among the newly eligible population because it provided a clear call to action while providing steps and instructions on how to complete a process that might be new to the primary care giver of a newly eligible child. Statistical analysis was conducted using a logit multiple regression model and results were robust to the inclusion of controls for language, geography, and children’s age.


Additional Insights

Age and Regional Variations

Additional exploratory analyses were conducted in order to identify factors that influence CLB take-up. Children’s age was one important factor. In general, the older the child, the less likely the primary care giver was to open an RESP and request the CLB. Regional variations were also observed. CLB uptake was generally higher in Western Canada and Quebec. Many of these provinces (British Columbia, Saskatchewan, Quebec) had additional educational savings incentives tied to RESPs at the time of the trial, which may explain the higher levels of uptake. Take-up rates tended to be lower in Ontario and Atlantic Canada. These findings are consistent with those from previous mailing initiatives.ix

Parents Requesting the CLB for Some of their Eligible Children

Some primary caregivers that requested the CLB in response to the letter did not request it for all of the children under their care. Specifically, about 13% of primary caregivers did not request the CLB for all of the eligible children under their care. More research is needed to understand what drives this behaviour.

The Need for Reminders

For primary caregivers with previously eligible children who have received one or more letters before, receiving the highest performing letters in this trial (with the cheque add-on) tripled CLB take-up. This suggests that repeatedly contacting primary caregivers in different ways might be effective.

Value of Money

The CLB is available to all eligible children from low-income families. As mentioned earlier, the CLB currently has a take-up rate of 34.7%, meaning that 1.81 million eligible children have yet to receive the education savings incentive.

Based on the costs of mail-outs in this trial, the cost per sign-up on average was $32.75. The cost per sign-up for newly eligible households was $21.54 due to the higher take-up rates. Previously eligible children were more costly to sign-up with mail outs, with a cost per sign-up of $45.53. These costs reflect the fact that some individuals would have opened an RESP and requested the CLB on behalf of their children even if they would not have received a letter. These figures do not represent the operating costs of the program in general, and may not be generalizable to other initiatives aimed at promoting the CLB or other programs for low-income families.

Conclusion

This randomized controlled trial tested a series of letters designed to increase take-up of the Canada Learning Bond among eligible children from low-income families. Modifications to some text elements in the letter that was used by ESDC to encourage CLB enrolment did not result in a statistically significant increase in the number of primary caregivers signing up. However, behaviourally informed additions to the letters were found to increase CLB take-up. A mock cheque added to the bottom of the letter increased take-up among primary caregivers of children that have been previously eligible for the CLB. For primary caregivers of newly eligible children, a checklist that provided a concrete call to action and provided instructions was found to increase take-up of the CLB.

The results of this trial suggest that targeted approaches using behavioural insights through use of interventions and experimentation may help to address specific behavioural barriers that prevent participation in public programs, such as the education savings incentives administered by ESDC. Taking the best performing additions in this trial to scale would result in thousands more children benefiting from the CLB and help them afford post-secondary education.

Since the culmination of this trial, ESDC has incorporated the best performing addition, as well as other enhancements to the letters in its direct mailings to Canadians with children eligible for the CLB. ESDC’s Learning Branch is a leader in employing innovative approaches to increasing take-up of the CLB and continues to work to improve programs, policies and processes in this space. The IIU would like to thank the Learning Branch and the Innovation Lab at ESDC for making this trial possible and for their work in improving the standard of living and quality of life for all Canadians.


Library and Archives Canada Cataloguing in Publication

Increasing Take-Up of the Canada Learning Bond

Information contained in this publication or product may be reproduced, in part or in whole, and by any means, for personal or public non-commercial purposes without charge or further permission, unless otherwise specified. Commercial reproduction and distribution are prohibited except with written permission from the Privy Council Office.

For more information, contact:

Impact Canada, Privy Council Office
85 Sparks Street, Room 1000
Ottawa ON Canada K1A 0A3
info@pco-bcp.gc.ca

© His Majesty the King in Right of Canada, 2024.


Cette publication est également disponible en français : Accroître l’adhésion au Bon d’études canadien

ISBN: CP22-162/2018E-PDF
978-0-660-27036-4