Report

COSMO Wave 1.9

New questions on vaccine intentions, misinformation and disinformation, use of the COVID-19 Alert App, COVID-19 testing, and holiday gatherings

Public Health Agency of Canada
Public Opinion Research Team, Privy Council Office
Impact Canada, Impact & Innovation Unit, Privy Council Office
Covid alert app icon on cell phone

Key Insights

This report focuses on the results for the ninth wave of this research. 2,055 Canadians aged 18 and older were surveyed between November 2 to 9, 2020. The data was weighted to ensure that the sample distribution reflects the actual Canadian adult population according to Statistics Canada census data. There is no associated margin of error for the results, since a non-probability design means that results cannot be projected to the larger population.

Public Risk Perceptions: In Wave 9, there was a significant increase in the proportion of the sample who think that “we are currently experiencing the worst of the crisis,” and a sharp decline in the portion of people who think that the worst of the crisis is behind us. The highest proportion of respondents still think that “the worst of the crisis is yet to come”. Certain groups are more likely to think that “the worst is yet to come,” including those aged 55+ (54%), residents living in British Columbia and the Yukon (59%) and Alberta and the Northwest Territories (53%).

Information Sources: Trust in government information sources has declined since the beginning of the pandemic. Respondents aged 18-34 have consistently reported lower levels of trust in most government sources. Trust in government information sources also varies by province/territory and is generally the highest in British Columbia and the Yukon, and the lowest in Alberta and the Northwest Territories.

Compliance with Protective Behaviours: Adherence to key protective behaviours such as mask wearing (81%), using hand sanitizer (79%), frequent hand washing (72%) and physical distancing (71%) remains high. Men and younger respondents in the sample continue to indicate lower compliance with recommended protective behaviours.

Holidays: Despite public health guidance in some provinces and high numbers of people indicating they were aware of gathering limits in their area (89%), a high proportion of respondents report that they had indoor, in-person gatherings at Thanksgiving (42%). More Canadians will observe December holidays than Thanksgiving, and a sizable proportion may not heed public health advice to limit gatherings.

Vaccine confidence: The Wave 9 survey asked respondents about their intentions to vaccinate across several different measures to add nuance to our growing understanding of hesitancy and its drivers. Using a 7-point scale from ‘Strongly Disagree’ to ‘Strongly Agree’, respondents were asked whether they would get a safe vaccine if it becomes available and recommended to them. 61% either agreed or strongly agreed that they would. This declined in Wave 9 after remaining stable at about 65% since Wave 4 (May 26-June 1).

Returning to "Normal": 52% of respondents visited with friends and family indoors in the past two weeks, signalling that while most do not intend to gather in large groups many people are still seeing friends and family. Only 23% of respondents think that it is likely that they will go to an indoor gathering with ten or more people within the next year.

Travel Intentions and Border Measures: A majority of respondents would like to see both US restrictions (86%) and international restrictions (83%) remain in place for 1-6+ months. There is low comfort overall with increasing travel, however, Canadians may be slightly more comfortable with increased travel from countries with fewer COVID-19 cases.

Background

To support federal response efforts, Impact Canada is leading the implementation of the World Health Organization (WHO) Behavioural Insights (BI) Tool on COVID-19 in the Canadian context. This work is led in collaboration with the Public Opinion Research Team within the Privy Council Office’s (PCO) Communications and Consultation Secretariat, which supports the Prime Minister’s Office in coordinating government communications in accordance with key priorities.

Methodology

With a longitudinal design, the study follows 2,000 participants recruited from an online panel over sixteen data collection waves. New participants are added only when an original panelist stops participating.

Respondents are a representative mix of Canadian adults aged 18 years and older and results are weighted using 2016 Statistics Canada census data to mirror the population distribution in Canada.

Considerations

When interpreting the COSMO results it is useful to keep in mind the context of the data collection period, which may or may not have influenced the responses of survey participants.

During the Wave 9 data collection period (Nov 2-9, 2020):

  1. COVID-19 cases were surging in most provinces and territories. The national COVID-19 case numbers in Canada as of November 3 were 244,935 (including 2,974 new cases).
    • British Columbia reported 299 new cases and a total of 3,098 active cases, with 5.9 cases per 100,000 people.
    • Alberta had 570 new cases and a total of 6,110 active cases, with 13.0 cases per 100,000 people.
    • Saskatchewan reported 81 new cases and a total of 842 active cases, with 6.9 cases per 100,00 people.
    • Manitoba reported 102 new cases and a total of 3,495 active cases, with 7.4 cases per 100,000 people.
    • Ontario reported 1,050 new cases for a total of 8,295 active cases, with 7.2 cases per 100,000 people.
    • Quebec reported 871 new cases yesterday for a total of 9,256 active cases, with 10.3 cases per 100,000 people.
    • NL, NB, NS, PEI, YT, NT and NU all reported 0 new cases and 0 cases per 100,000 people (except NS - 0.1 per 100,000).
  2. Increasing case rates were being reported in many countries around the world, coupled with a return to modified lock-down measures in certain countries (e.g. Western Europe, UK).
  3. The US Presidential election was underway. Election day was November 3 and on November 7 Joe Biden became the President-Elect as reported by major US media outlets.
  4. On November 9 (the last day of COSMO data collection) Pfizer and Biontech announced that the first interim efficacy analysis of their phase 3 study found their vaccine to be over 90% effective. The announcement is not likely to have impacted the results of this Wave of data collection but Wave 10 data will likely reflect what impact, if any, this announcement and subsequent vaccine announcements (i.e. Moderna, AstraZeneca, Janssen) has had on vaccine intentions.

This page may refer to ‘respondents of the survey’ as ‘Canadians’, or other semantic generalizations. This is for readability only, and is not an endorsement or postulation that estimates should be extrapolated beyond the sample.

Public Risk Perceptions

In Wave 9, there was a significant increase in the proportion of the sample who think that “we are currently experiencing the worst of the crisis,” and a sharp decline in the portion of people who think that the worst of the crisis is behind us. The highest proportion of respondents still think that “the worst of the crisis is yet to come”. Certain groups are more likely to think that “the worst is yet to come,” including those aged 55+ (54%), residents living in British Columbia and the Yukon (59%) and Alberta and the Northwest Territories (53%).

Over Waves 1 to 7 there was a gradual decline in the proportion of Canadians who felt that COVID-19 was “spreading fast” (W1: 56%, W7: 31%). However, in Wave 8, this number increased slightly (35%) and in Wave 9, there was a significant increase (48%). Since the beginning of the crisis, higher numbers of Quebec respondents have reported that COVID-19 feels like it is “spreading fast,” compared to respondents in other provinces and territories. In Wave 9, however, respondents living in Manitoba, Saskatchewan and Nunavut were the most likely to report that COVID-19 is “spreading fast” (57%).

Information Sources

Trust in government information sources has declined since the beginning of the pandemic. Respondents aged 18-34 have consistently reported lower levels of trust in most government sources. Trust in government information sources also varies by province/territory and is generally the highest in British Columbia and the Yukon, and the lowest in Alberta and the Northwest Territories.

In Wave 9, respondents were given a series of statements and had to indicate whether they thought the statements were either accurate or “fake news”. Responses indicate that many respondents are susceptible to false information. Men and young people may be more susceptible to misinformation. For example, 20% of respondents thought the following statement was “probably true” or “definitely true”: “The fatality rate of COVID-19 has been deliberately and greatly exaggerated”. 34% of men aged 18-34 and 26% of men aged 35-54 thought the statement was “probably true” or “definitely true”. Men and young people were also more likely to get their information about COVID-19 from social sources, such as friends and family and social media.

Compliance with Protective Behaviours

Adherence to key protective behaviours such as mask wearing (81%), using hand sanitizer (79%), frequent hand washing (72%) and physical distancing (71%) remains high. Men and younger respondents in the sample continue to indicate lower compliance with recommended protective behaviours. For example, only 52% of young men (18-34) report that they always or almost always practice physical distancing (i.e., staying at least 2 meters from others) to keep from getting sick with COVID-19.

Holidays

Despite public health guidance in some provinces and high numbers of people indicating they were aware of gathering limits in their area (89%), a high proportion of respondents report that they had indoor, in-person gatherings at Thanksgiving (42%). More Canadians will observe December holidays than Thanksgiving, and a sizable proportion may not heed public health advice to limit gatherings. 82% of respondents report that they typically celebrate holiday gatherings in-person and 63% of respondents would be prepared to cancel in-person gatherings this year if that was recommended by public health officials in response to COVID-19. However, some respondents are unwilling (14%) to cancel in-person gatherings, would “maybe” (20%) cancel in-person gatherings, or are unsure (4%) whether they would.

Vaccine confidence

The Wave 9 survey asked respondents about their intentions to vaccinate across several different measures to add nuance to our growing understanding of hesitancy and its drivers. Using a 7-point scale from ‘Strongly Disagree’ to ‘Strongly Agree’, respondents were asked whether they would get a safe vaccine if it becomes available and recommended to them. 61% either agreed or strongly agreed that they would. This declined in Wave 9 after remaining stable at about 65% since Wave 4 (May 26-June 1).

Using a categorical question, respondents were also asked: ‘If a COVID-19 vaccine became available to you, would you get vaccinated, or not?’ with the following response options: ‘Yes, I would get a COVID-19 vaccine as soon as it became available to me’; ‘Yes, I would eventually get a COVID-19 vaccine, but would want to wait a bit’; ‘No, I would not get a COVID-19 vaccine’; and, ‘Not sure’. When the option to defer choice was introduced, 43% of respondents indicated that they would get vaccinated right away and 33% said that they would want to wait before getting vaccinated. In a follow up question presented only to respondents who indicated that they plan to wait, most said they want to wait a month or two (37%), or several months (27%). 65% of those who want to wait go onto indicate that their primary reason for waiting is to ensure the safety of the vaccines and that there are no side effects, and 23% would wait to ensure the effectiveness of the vaccine.

Returning to Normal

52% of respondents visited with friends and family indoors in the past two weeks, signaling that while most do not intend to gather in large groups many people are still seeing friends and family. Only 23% of respondents think that it is likely that they will go to an indoor gathering with ten or more people within the next year. Young people (30%) are more likely than older respondents (17%) to indicate that they will gather with groups of ten or more within the next year. People living in the Atlantic provinces (34%) are more likely than respondents living in other provinces and territories to think that they will gather in large groups, and residents of British Columbia and the Yukon (15%) are less likely.

Travel Intentions and Border Measures

A majority of respondents would like to see both US restrictions (86%) and international restrictions (83%) remain in place for 1-6+ months. There is low comfort overall with increasing travel, however, Canadians may be slightly more comfortable with increased travel from countries with fewer COVID-19 cases. For example, 13% of respondents were comfortable increasing travel with Australia, 11% were comfortable increasing travel with South Korea, and 10% were comfortable increasing travel with Japan. Respondents were most uncomfortable allowing greater travel with India (78%) and Brazil (78%).

Published: 2021-11-12
Last modified: 2025-05-25
Research Brief

Operational Transparency Study

Testing the impacts of operationally transparent communication approaches on COVID-19 vaccine intentions among unvaccinated Canadians

Drs. Michael Norton and Ryan Buell, Harvard Business School
Impact Canada, Impact & Innovation Unit, Privy Council Office
Drawing of a mountain climb map, from basecamp to the peak

Summary

In collaboration with Drs. Michael Norton and Ryan Buell from Harvard Business School, Impact Canada conducted an online survey experiment to test the impacts of operationally transparent communication approaches on COVID-19 vaccine intentions among unvaccinated Canadians. Operational transparency refers to the open communication of “behind-the-scenes” work that an organization undertakes through its operating processes (Buell and Norton, 2011) - in the present case, communication about the COVID-19 vaccine development and approval process in Canada. This experiment was conducted between August 19 and October 4, 2021 with a sample of ~1,550 unvaccinated Canadians. The study provided rich insights into the intentions, attitudes, and behaviours of Canadians who had not received a single dose of any COVID-19 vaccine at a time when a large majority (80%+) of Canadians had received at least one dose. The results of the experiment suggest that messaging employing principles of operational transparency - specifically those describing the funneling of vaccine candidates through the development process - is more effective at boosting self-reported vaccine intentions among unvaccinated Canadians, compared to standard Government of Canada communications approaches.

Background Research and Origins

In March 2020, the IIU launched a program of applied behavioural science research to support the Government’s COVID-19 response efforts in accurately and effectively promoting key behaviours recommended by public health experts. As one part of this research, the IIU - in close partnership with the Public Health Agency of Canada (PHAC) - studied Canadians’ attitudes and intentions related to COVID-19 vaccines.

Using online survey and experimentation platforms, the IIU has conducted ‘deep-dive’ explorations of critical public health behaviours and tested public health messaging using experimental and quasi-experimental designs. Studies to date have collected data from tens of thousands of Canadians - identifying factors such as best-performing messaging strategies and policy intervention opportunities. These deep-dive explorations have included multiple studies examining the impacts of various behaviourally-informed, communication-based interventions on vaccine acceptance in the COVID-19 context, including three studies that applied principles of operational transparency.

Operational transparency refers to the disclosure of “behind-the-scenes” work that an organization undertakes through its operating processes (Buell and Norton, 2011). While the IIU has tested the effects of operational transparency in the past, previous work focused primarily on written-format interventions and explored the application of operational transparency narrowly as one condition within each larger study.

IIU studies, in addition to those in the literature, provided preliminary evidence on the value of operational transparency into the systems that develop, test and approve vaccines, as a means of improving understanding, trust, and confidence in vaccines. Building on this preliminary evidence, the IIU conducted a dedicated experiment to better understand the effects of different forms of social media-based operationally transparent messaging on COVID-19 vaccine acceptance and uptake, testing 4 visual instantiations aimed at:

 
  • Disclosing the ‘end-to-end’ process for vaccine development, testing, authorization and regulation in Canada; and

  • Describing and visualizing the concept of benefits outweighing risks in the context of vaccine authorization.

Study Design

A sample of 1,554 unvaccinated Canadians were recruited between August 19 and October 4, 2021 to participate in an online survey experiment deployed through Qualtrics. Efforts were made to ensure that the sample reflected the population distribution in Canada(using the 2016 Canadian Census); however quota-matching was relaxed due to the difficulty of recruiting a sufficient number of unvaccinated Canadians, who were a minority in the population at the time of data collection.

Respondents were screened into the study based on their self-reported vaccination status. Only respondents with no doses of a COVID-19 vaccine were selected to complete the study.

Figure 1 - Sample Selection
Text version - Figure 1

This figure illustrates the number of participants in the final analyses. Initially, 12,542 participants were recruited through the Qualtrics survey platform (not including the 455 people identified as spam participants). 10,311 participants consented to participate (540 participants did not consent, and 1690¬ participants did not advance past the consent screen). Of these participants, 2,078 indicated that they had not received any COVID-19 vaccines; 1,794 participants completed the study, and of those 1,554 were included for analysis as the remaining participants were excluded for demonstrating bot characteristics, or taking too long to complete the survey.


Screened-in respondents were randomly assigned to one of six groups (two control conditions and four operationally transparent intervention conditions; see below). Stratified randomization was applied to ensure the balance of the treatment/control groups with respect to age and gender. Each group viewed a different experimental condition before being directed to a survey that queried vaccine intentions1, among a suite of other self-reported COVID-related beliefs, attitudes, and behaviours.

Figure 2 - Study Design
Text version - Figure 2

The graphic illustrates how participants were assigned to conditions, and the visual they saw as a result. All participants were assigned to one of six conditions. Those in the Passive Condition saw no visuals; those in the Active Control saw status-quo messaging related to COVID-19 vaccine safety; those in Intervention #1 saw visuals relating to the end-to-end process of vaccine development; those in Intervention #2 saw a visual that compared the typical vaccine development process with the one used for the COVID-19 vaccine; those in Intervention #3 saw the Success Funnel condition detailing how many vaccine candidates were at each stage of the development process; and those in Intervention #4 saw visual detailing the phrase “benefits outweigh the risks”. Following this, all participants were asked to complete measures related to the main outcome variables (intentions to get the COVID-19 vaccine, trust/confidence in COVID-19 vaccines); there behaviour while viewing the conditions was also collected. Finally, all participants were also given additional questions that measured other variables of interest (E.g. perceptions/knowledge of vaccine development, testing and the regulation process; beliefs/behaviour related to COVID-19; demographic characteristics; etc.)

Conditions

The experimental conditions were mock Twitter threads, each consisting of five tweets. Participants were presented with the first tweet of a thread and were able to expand the thread, and click on a link within the thread that went to a page with more information on vaccine approvals. The experimental conditions were as follows:

1. Passive Control (No Visual)

Respondents did not see a visual condition and were directed right to the survey.

2. Active Control (Standard Government of Canada Messaging)

Displayed a series of real-world tweets about vaccine safety that were previously posted on HC/PHAC social media channels

View mock Twitter thread
Health Canada and PHAC
@GovCanHealth

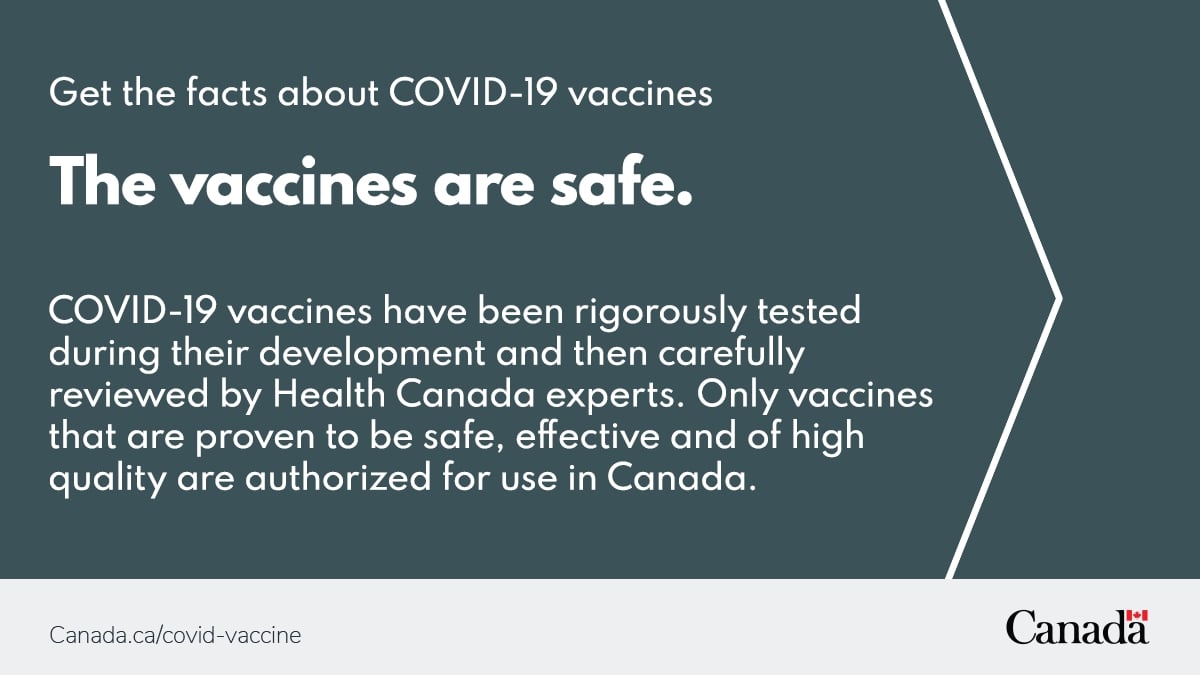
(1/5) Fact: Only vaccines that are proven to be safe, effective, and of high quality are authorized for use in Canada. When your turn comes, roll up your sleeve and get the CovidVaccine.

2:41 PM · Apr 27, 2021
30 Retweets 175 Likes
Health Canada and PHAC
@GovCanHealth

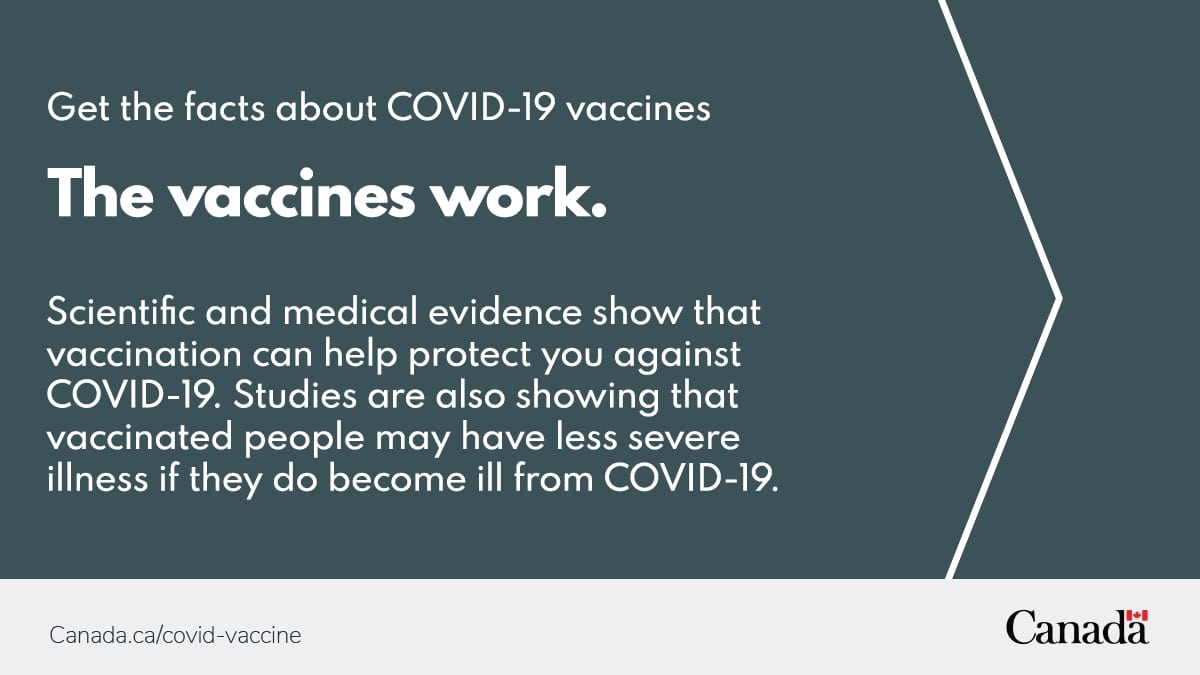
(2/5) Fact: Vaccines are critical in our efforts to stop #Covid19. Vaccines are safe, effective, and work.

Health Canada and PHAC
@GovCanHealth

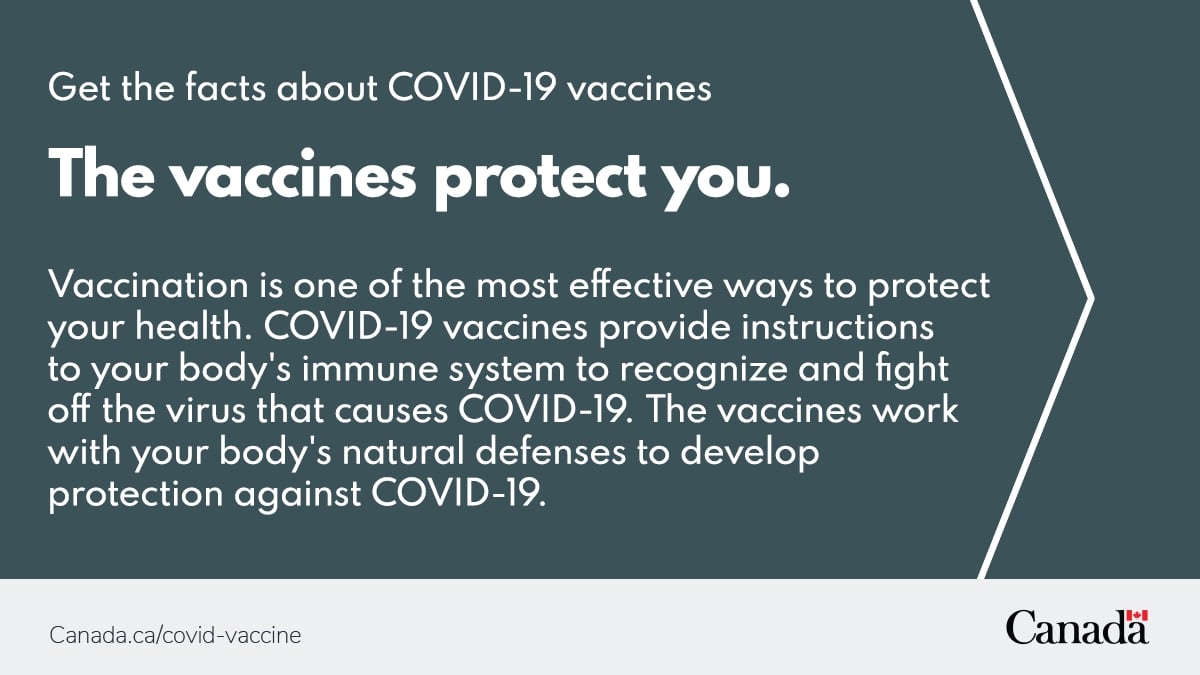
(3/5) Fact: Vaccines are our number one protection against #COVID19. #VaccinesWork

Health Canada and PHAC
@GovCanHealth

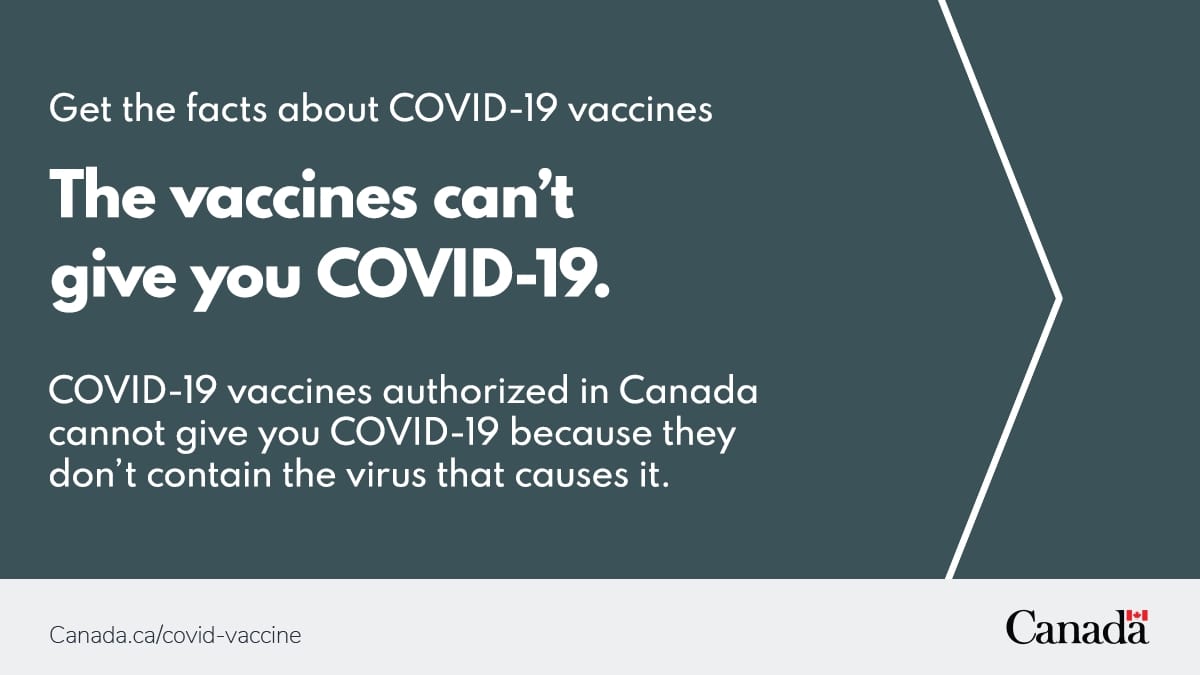
(4/5) Fact: The #CovidVaccine can’t give you the virus – it protects you against it. #VaccinesWork

Health Canada and PHAC
@GovCanHealth

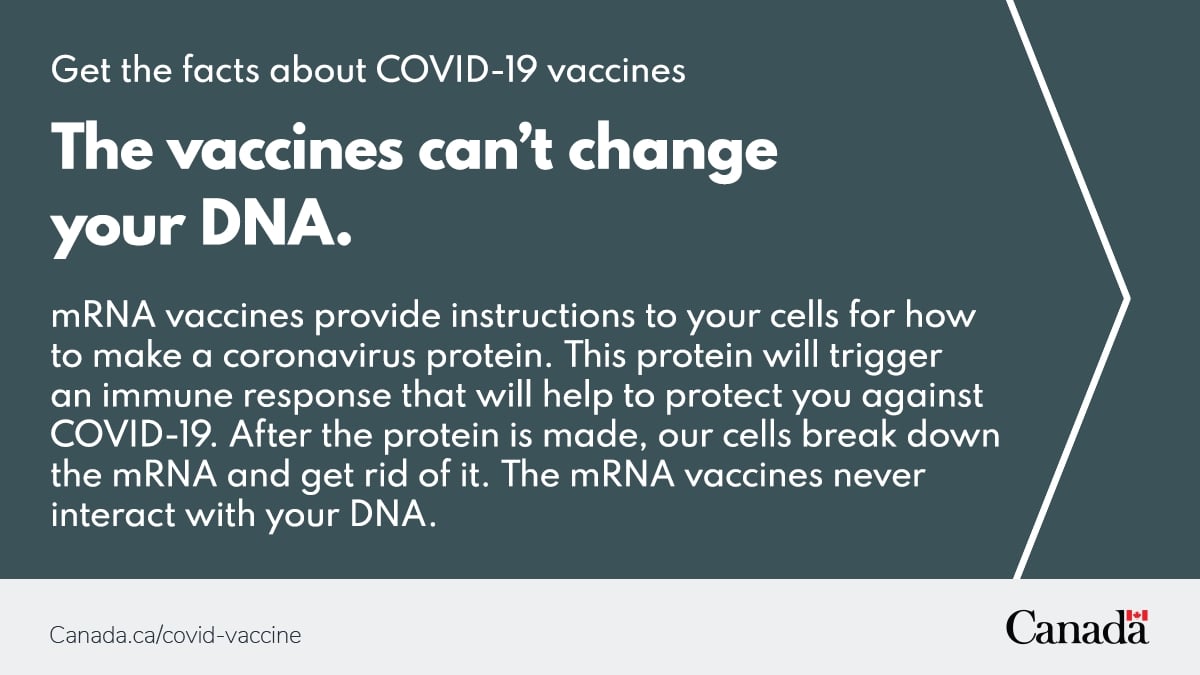
(5/5) Fact: #COVID19 vaccines are safe and effective and can’t change your DNA. #VaccinesWork

3. Treatment 1 (End-to-End Process)

Visualized the main stages in the vaccine development and approval process in Canada, aiming to address concerns that not enough testing and research has been done.

View mock Twitter thread
Health Canada and PHAC
@GovCanHealth

(1/5) Any #COVID-19 vaccines approved in Canada must pass a rigorous assessment and approval process. View this thread to learn about each step. #SleevesUp

2:41 PM · Apr 27, 2021
30 Retweets 175 Likes
Health Canada and PHAC
@GovCanHealth

(2/5) Scientists run studies to find vaccines that could help us develop immunity against COVID-19. Vaccines are tested in the laboratory and with animals to make sure they are safe before testing in humans.

Health Canada and PHAC
@GovCanHealth

(3/5) Vaccines are tested in three phases of clinical trials, starting with a small number of volunteers and expanding to tens of thousands of volunteers.

Health Canada and PHAC
@GovCanHealth

(4/5) Health Canada experts complete a detailed review of the scientific data before making a decision to approve or reject the vaccine.

Health Canada and PHAC
@GovCanHealth

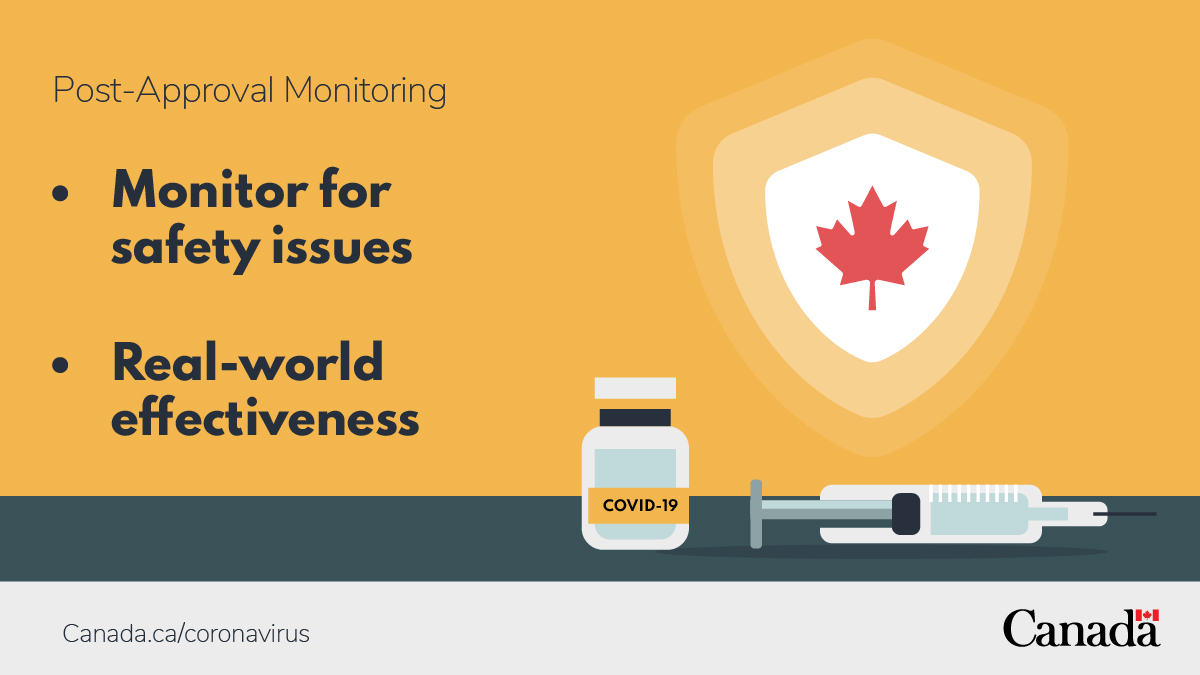
(5/5) After approval, federal, provincial/territorial, and local health authorities continuously monitor vaccines for safety. Canada’s robust system is able to detect adverse events like serious side effects that are too rare to detect in large clinical trials.

4. Treatment 2 (Typical vs. ‘Rapid’ COVID Process)

Visualized the main stages of the vaccine development and approval process in Canada, aiming to address the concern that the COVID-19 vaccine process was rushed. The tweets showed that, while some stages overlapped, no steps were skipped.

View mock Twitter thread
Health Canada and PHAC
@GovCanHealth

(1/5) A global effort, large investments in research and manufacturing, and new approaches paved the way for the speedy development of #COVID19 vaccines without compromising safety. #SleevesUp

2:41 PM · Apr 27, 2021
30 Retweets 175 Likes
Health Canada and PHAC
@GovCanHealth

(2/5) The genetic code of the SARS-CoV-2 virus was published in January 2020, allowing scientists from across the globe to carry out laboratory and animal studies to find vaccines that could be safe and effective in humans.

Health Canada and PHAC
@GovCanHealth

(3/5) Vaccines are tested in three phases of clinical trials, starting with dozens of volunteers and expanding to tens of thousands. Due to high COVID-19 case numbers in many places, and overlapping clinical trial stages, vaccine efficacy was measured quicker than usual.

Health Canada and PHAC
@GovCanHealth

(4/5) Health Canada experts complete a detailed review of the scientific data before making a decision to approve or reject the vaccine. For COVID-19 vaccines, study data was submitted as it became available, allowing the review process to start much earlier.

Health Canada and PHAC
@GovCanHealth

(5/5) After approval, federal, provincial/territorial, and local health authorities continuously monitor vaccines for safety. Canada’s robust system is able to detect adverse events like serious side effects that are too rare to detect in large clinical trials.

5. Treatment 3 (Success Funnel)

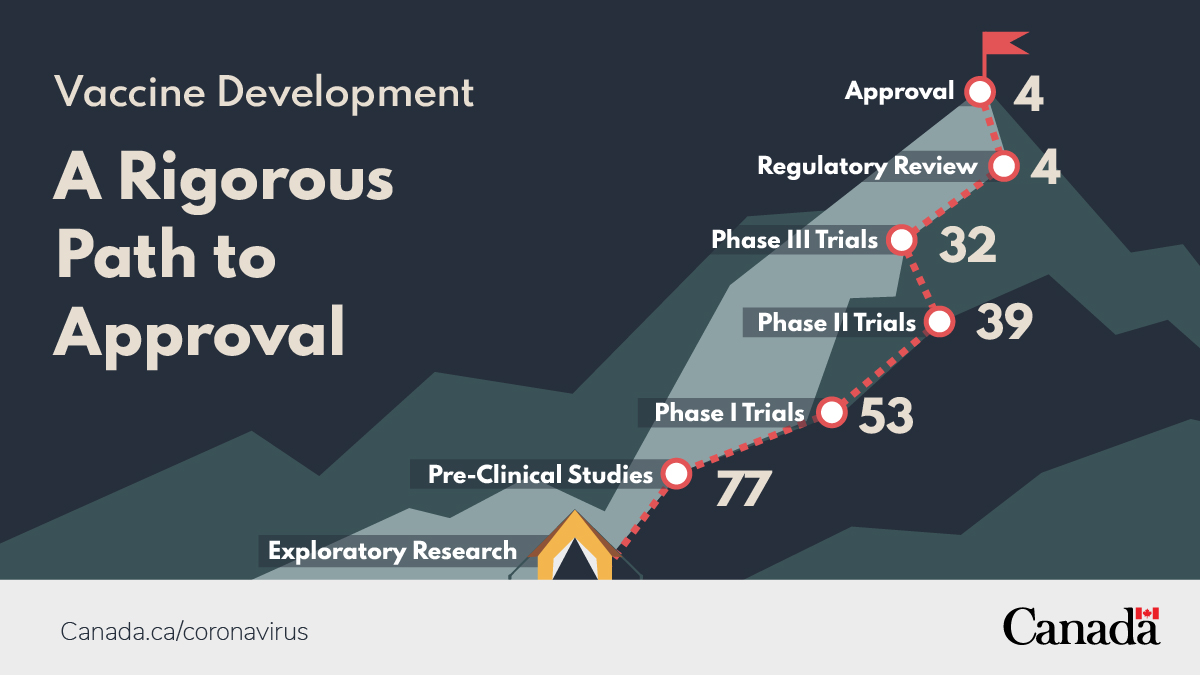
Described the number of vaccine candidates at each stage of the vaccine development and approval process with a visual of climbing a mountain and reaching the “peak” - approval. This condition aimed to show that only vaccines that meet safety and effectiveness criteria make it to the approval stage, and some candidates fall out at each stage of the process.

View mock Twitter thread
Health Canada and PHAC
@GovCanHealth

(1/5) Any #COVID-19 vaccines approved in Canada must pass a rigorous assessment and approval process.View this thread to learn about each step. #SleevesUp

2:41 PM · Apr 27, 2021
30 Retweets 175 Likes
Health Canada and PHAC
@GovCanHealth

(2/5) Scientists run studies to find vaccines that could help us develop immunity against COVID-19. Vaccines are tested in the laboratory and with animals to make sure they are safe before testing in humans.

Health Canada and PHAC
@GovCanHealth

(3/5) Vaccines are tested in three phases of clinical trials, starting with a small number of volunteers and expanding to tens of thousands of volunteers.

Health Canada and PHAC
@GovCanHealth

(4/5) Health Canada experts complete a detailed review of the scientific data before making a decision to approve or reject the vaccine.

Health Canada and PHAC
@GovCanHealth

(5/5) After approval, federal, provincial/territorial, and local health authorities continuously monitor vaccines for safety. Canada’s robust system is able to detect adverse events like serious side effects that are too rare to detect in large clinical trials.

6. Treatment 4 (Benefits Outweigh the Risks)

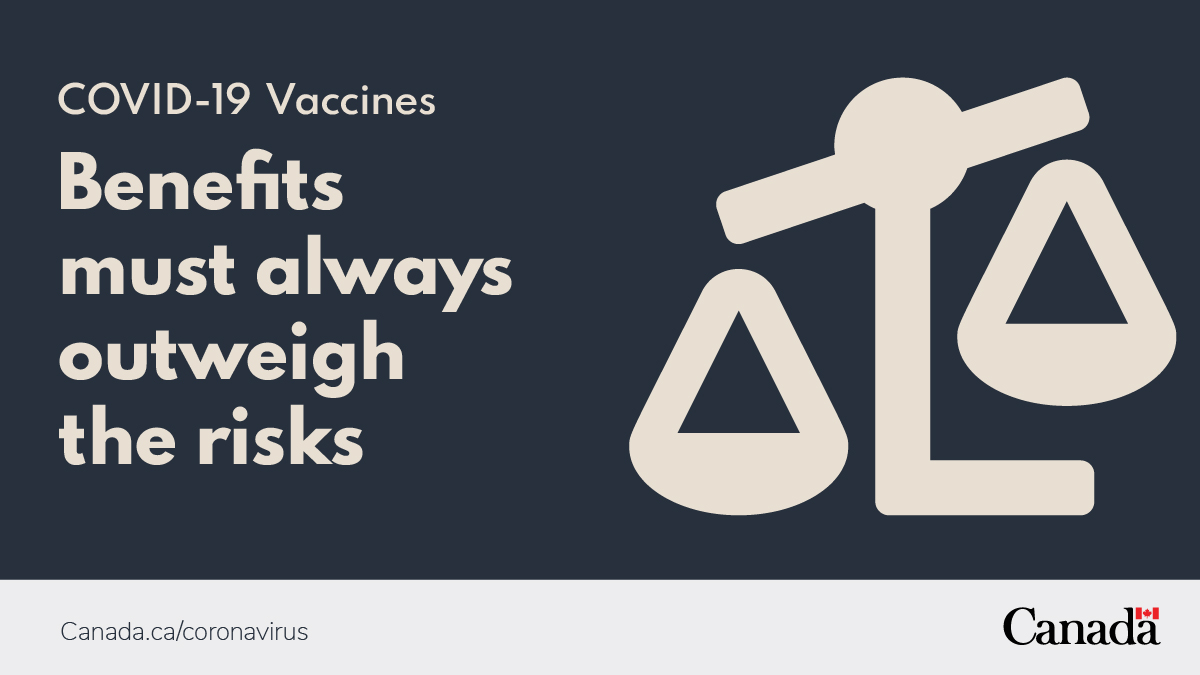
Explained the meaning behind “the benefits outweigh the risks” for vaccines in Canada. The tweets quantified the benefits (vaccine efficacy) and risks (side effects) to help people understand what goes into risk-benefit calculations during the vaccine review and authorization process.

View mock Twitter thread
Health Canada and PHAC
@GovCanHealth

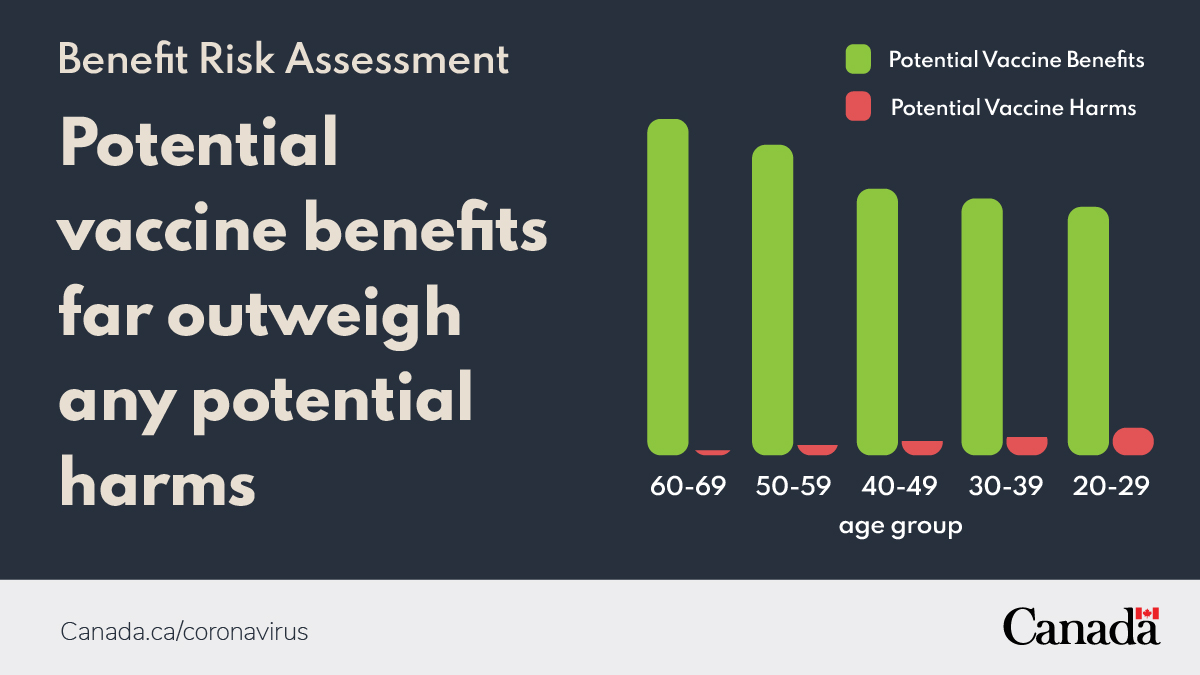
(1/5) For all COVID-19 vaccines used in Canada, the benefits of the vaccine must outweigh the risks. But what type of “benefits” and “risks” are we talking about when making these decisions? #SleevesUp

2:41 PM · Apr 27, 2021
30 Retweets 175 Likes
Health Canada and PHAC
@GovCanHealth

(2/5) The COVID-19 virus, and its variants, can infect many people very quickly and the estimated mortality rate is much higher than the flu. Older adults and those with underlying conditions are at higher risk for poor outcomes.

Health Canada and PHAC
@GovCanHealth

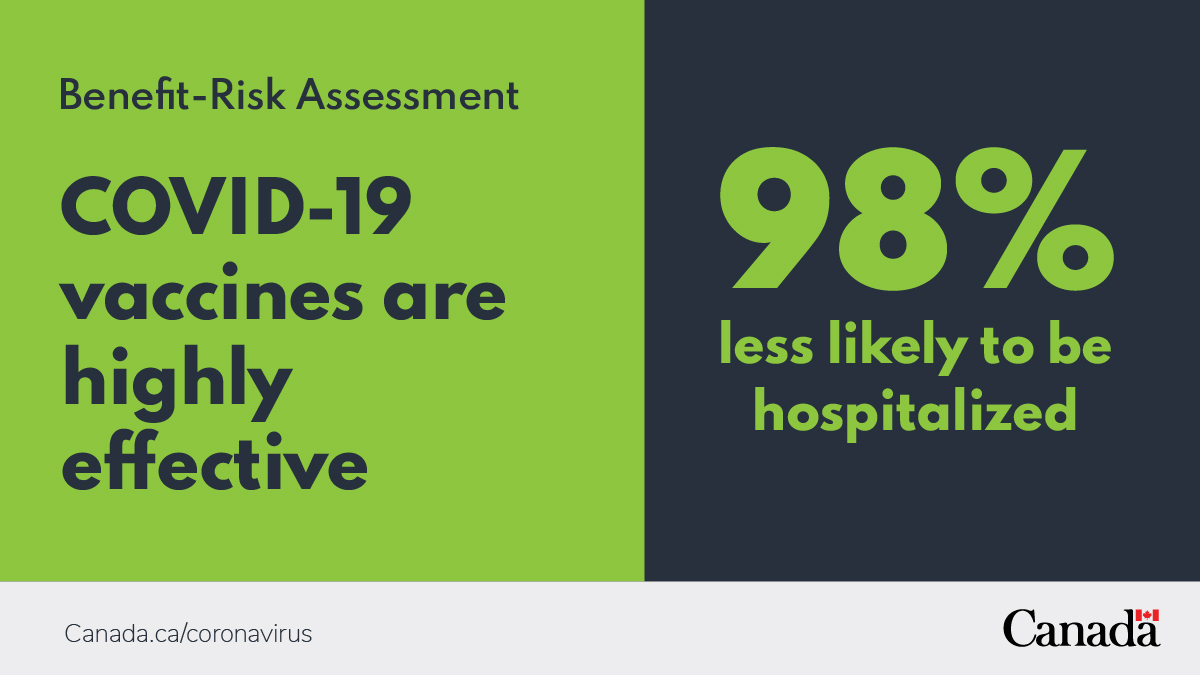
(3/5) All COVID-19 vaccines approved for use in Canada are very effective in preventing COVID-19. Studies suggest that vaccinated people are 98% less likely to be hospitalized.

Health Canada and PHAC
@GovCanHealth

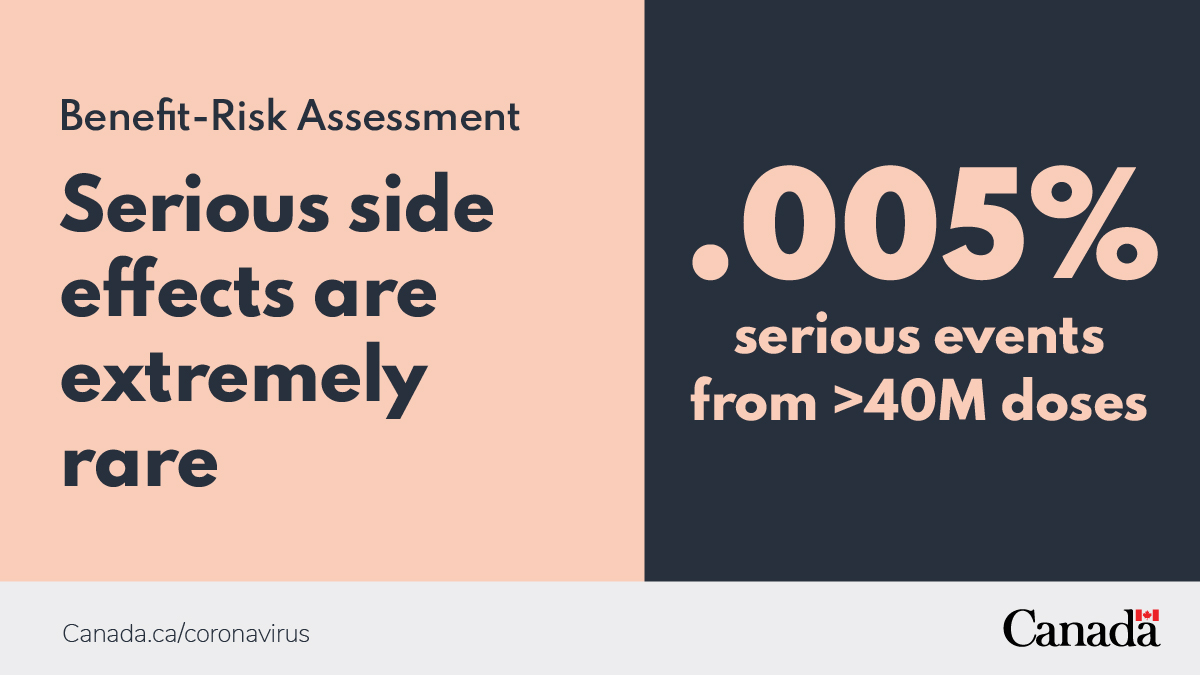
(4/5) All COVID-19 vaccines have minimal reported side effects (like headaches, feeling feverish, fatigue) and serious side effects are extremely rare (1 in 18,310 people)

Health Canada and PHAC
@GovCanHealth

(5/5) As COVID-19 infections grow or flatten, the risk of the virus changes and so may recommendations. Health Canada is constantly ensuring that the benefits of vaccines outweigh their risks and the risks posed by COVID-19.

Study Findings

Finding 1

Status quo approaches to communicating about vaccine safety may have unintended consequences for unvaccinated Canadians.

On average, respondents in the Active Control group (i.e.,tweets that had previously been communicated by the Government of Canada about vaccine safety) reported statistically significantly lower intentions to be vaccinated, compared to respondents who were exposed to the Passive Control (i.e., those who were shown nothing).

 
Figure 3 - Average Intention to Vaccinate across Active vs. Passive Controls

Figure 3 - Average Intention to Vaccinate across 
                  Active vs. Passive Controls
Text version - Figure 3

This figure illustrates the difference in average intention to get the COVID-19 vaccine between those in the Passive Control group, and those in the Active Control group. Those in the Passive Control group have significantly higher intentions to vaccinate (M = 2.96) relative to the Active Control group (M = 2.69).


Finding 2

Respondents exposed to the “Success Funnel” condition reported, on average, 13% higher intentions to vaccinate against COVID-19, relative to status quo Government communications about vaccine safety (i.e., Active Control condition).

On average, those in the “Success Funnel” condition had vaccine intentions that were significantly (statistically) higher relative to the active control group2. Vaccine intentions for those in the other three operational transparency conditions were not significantly different from the Active Control condition. Additionally, intentions were not significantly different between the operational transparency conditions.

These findings suggest that “showing” the behind-the-scenes work that goes into ensuring vaccines are safe and effective may be more effective than simply “telling” citizens that this is the case.

Figure 4 - Average Intention to Vaccinate across Active vs. Passive Controls diagram
Text version - Figure 4

A figure illustrating the difference in average vaccine intention between experimental conditions (excluding the Passive Condition). The Active Condition has the lowest average (2.69); the average vaccine intention of participants in OT groups are as follow:

  • End-to-end: 2.90
  • Typical vs. Rapid: 2.95
  • Success Funnel: 3.04
  • Benefits > Risks: 2.88

Those in the Success Funnel condition had significantly higher intentions to vaccinate, relative to those in the Active Control condition. Differences between the Active Control and the other OT conditions were not statistically significant. While the Success Funnel condition also performed better than the other OT conditions, there were no statistically significant differences between any of the OT conditions.

Limitations and Future Directions

When interpreting the results of this study, there are some key study limitations to bear in mind. Though the messaging conditions used mock tweets, the experiment was conducted in the context of an online survey, and therefore results have limited ecological validity. Testing these interventions using a simulated social media environment, or, better yet, directly on social media platforms where individuals interact with information in day-to-day life, will provide better estimates of real world impacts. Relatedly, the study only analyzed vaccine intentions and not actual vaccination behaviours. Though common, self-report data is a limitation because there are often discrepancies between individuals' stated intentions and their actions.

It is also worth considering that tweet viewing times in this study were relatively low (median = 12.47 seconds, across conditions). In addition, only 8.7% of respondents expanded the tweet threads. Most study participants, therefore, were only exposed to the first tweet in the threads, and for a relatively short time. The degree to which these engagement metrics align with real-world social media behaviour is unclear, though it is encouraging that we observed significant effects of operationally transparent messaging with relatively brief and low-demand engagement by participants. Tweet viewing and engagement did not vary as a function of condition.

More work is necessary to understand (A) how to best encourage engagement with social media messaging campaigns, and (B) how to maximize message effectiveness in the face of low expected engagement. This may indicate that social media campaigns should be ‘front-loaded’ with operationally transparent content to get the message across without requiring active user engagement.

Finally, while those who viewed the “Success Funnel” condition had higher vaccine intentions, relative to the active control, intentions were similar to those in the passive control condition (i.e. participants who saw no visuals). Future work should examine the potentially amplifying effects of operational transparency with trusted messengers outside of government (e.g. community leaders) - especially in those who distrust government as previous research suggests that the messenger can be just as, or more, important than the message itself.

Library and Archives Canada Cataloguing in Publication

Operational Transparency Study

Information contained in this publication or product may be reproduced, in part or in whole, and by any means, for personal or public non-commercial purposes without charge or further permission, unless otherwise specified. Commercial reproduction and distribution are prohibited except with written permission from the Privy Council Office.

For more information, contact:

Impact Canada, Privy Council Office
85 Sparks Street, Room 1000
Ottawa ON Canada K1A 0A3
info@pco-bcp.gc.ca

© His Majesty the King in Right of Canada, 2024.


Cette publication est également disponible en français : Étude sur la transparence opérationnelle

ISBN: 978-0-660-71277-2
CP22-217/2024E-PDF

Published: 2024-05-13
Last modified: 2025-05-26
Report

COSMO Wave 1.8

Vaccine confidence and vaccine hesitancy along with a focus on the harms and risk associated with increased alcohol use

Public Health Agency of Canada
Public Opinion Research Team, Privy Council Office
Impact Canada, Impact & Innovation Unit, Privy Council Office
hand holding a wine glass

Key Insights

This report focuses on the results for the second wave of this research. 2,117 Canadians aged 18 and older were surveyed between September 11 and 15, 2020. The data was weighted to ensure that the sample distribution reflects the actual Canadian adult population according to Statistics Canada census data. There is no associated margin of error for the results, since a non-probability design means that results cannot be projected to the larger population.

Continued focus on vaccine confidence and vaccine hesitancy along with an increased focus on the harms and risks associated with increased alcohol use.

More and more Canadians think that the “worst of the crisis is yet to come”

Up until Wave 5 of the survey, there was a steady increase in the number of respondents who thought “the worst of the crisis is behind us,” however, from Wave 5 to Wave 8 the percentage has declined from 41% to 26%. The percentage of respondents who think that the “worst of the crisis is yet to come” increased from 35% in Wave 5 to 49% by Wave 8 [ see chart ].

Increasing numbers of Canadians think that COVID-19 is ”spreading fast”

Over Waves 1 to 7 there was a gradual decline in the proportion of Canadians who felt that COVID-19 was “spreading fast” (W1: 56%, W7: 31%), however, in Wave 8, this number increased slightly (35%). [ see chart ].

Canadians are expecting long-lasting impacts of COVID-19

Canadians are expecting the impacts of COVID-19 to be long-lasting and many Canadians will avoid travelling to the US, going to large gatherings, flying on a plane, and using a ride-sharing service within the next year. Intentions to engage in some activities have decreased as the pandemic progresses. For example, the number of Canadians that think that it is likely that they will fly on a plane decreased from 19% in Wave 3 to 12% in Wave 8, and intentions to attend a large gathering decreased from 14% in Wave 3 to 8% in Wave 8 [ see chart ].

Support for public health measures remains steady

There is strong public support for extending some health measures for six months or longer and these numbers have increased or remained stable across waves. A majority of respondents believe that physical distancing should be extended for 6+ months, indicating that many Canadians are aware that COVID-19 will continue to impact day-to-day life into 2021 [ see chart ].

Opposition to lifting US and other international travel restrictions remains strong

The number of respondents that strongly disagree or disagree that travel restrictions between Canada and the US should be lifted has remained mostly stable between Waves 6 and 8. 77% of respondents are opposed to lifting Canada-US travel restrictions and 56% of respondents disagree that international (non-US) travel should be allowed to resume [ see chart ].

Vaccine confidence has declined since the beginning of the pandemic, and a consistent portion of Canadians remain undecided about whether to get vaccinated

65% of respondents strongly agree or agree that they would get a safe vaccine if it becomes available and only 43% think that vaccines are completely safe. 24% of Canadians are neutral or undecided about whether to get vaccinated. The proportion of people who disagree doubled from 6% in Wave 1 to 12% in Wave 5 and has remained stable since then. Concerns around a lack of research and testing, the safety/effectiveness of a vaccine, and the newness of the vaccine were the most prevalent reasons for not wanting to receive a safe vaccine once developed [ see chart ].

Background

To support federal response efforts, Impact Canada is leading the implementation of the World Health Organization (WHO) Behavioural Insights (BI) Tool on COVID-19 in the Canadian context. This work is led in collaboration with the Public Opinion Research Team within the Privy Council Office’s (PCO) Communications and Consultation Secretariat, which supports the Prime Minister’s Office in coordinating government communications in accordance with key priorities.

Methodology

With a longitudinal design, the study follows 2,000 participants recruited from an online panel over sixteen data collection waves. New participants are added only when an original panelist stops participating.

Respondents are a representative mix of Canadian adults aged 18 years and older and results are weighted using 2016 Statistics Canada census data to mirror the population distribution in Canada.

Selected Figures

A number of selected figures are presented below. For more information on the data set, please contact the Impact and Innovation Unit .

Respondent Profiles

Age

Canada (n=2,117) BC/Yukon (n=289) Alberta (n=240) Man/Sask (n=138) Ontario (n=810) Quebec (n=495) Atlantic (n=144)
18-34 years 27% 27% 32% 29% 27% 26% 23%
35-54 years 34% 34% 36% 34% 35% 33% 33%
55 years and older 39% 40% 32% 37% 38% 41% 44%

Gender

Canada (n=2,117) BC/Yukon (n=289) Alberta (n=240) Man/Sask (n=138) Ontario (n=810) Quebec (n=495) Atlantic (n=144)
Male 48% 48% 49% 49% 48% 49% 48%
Female 51% 52% 50% 51% 52% 51% 52%
Gender diverse 0.1% 0% 0.7% 0% 0% 0% 0%

Education

Canada (n=2,117) BC/Yukon (n=289) Alberta (n=240) Man/Sask (n=138) Ontario (n=810) Quebec (n=495) Atlantic (n=144)
High school or less 21% 20% 21% 30% 20% 19% 27%
College/trades 52% 50% 53% 47% 50% 56% 54%
University / post-graduate 27% 30% 27% 23% 30% 25% 19%